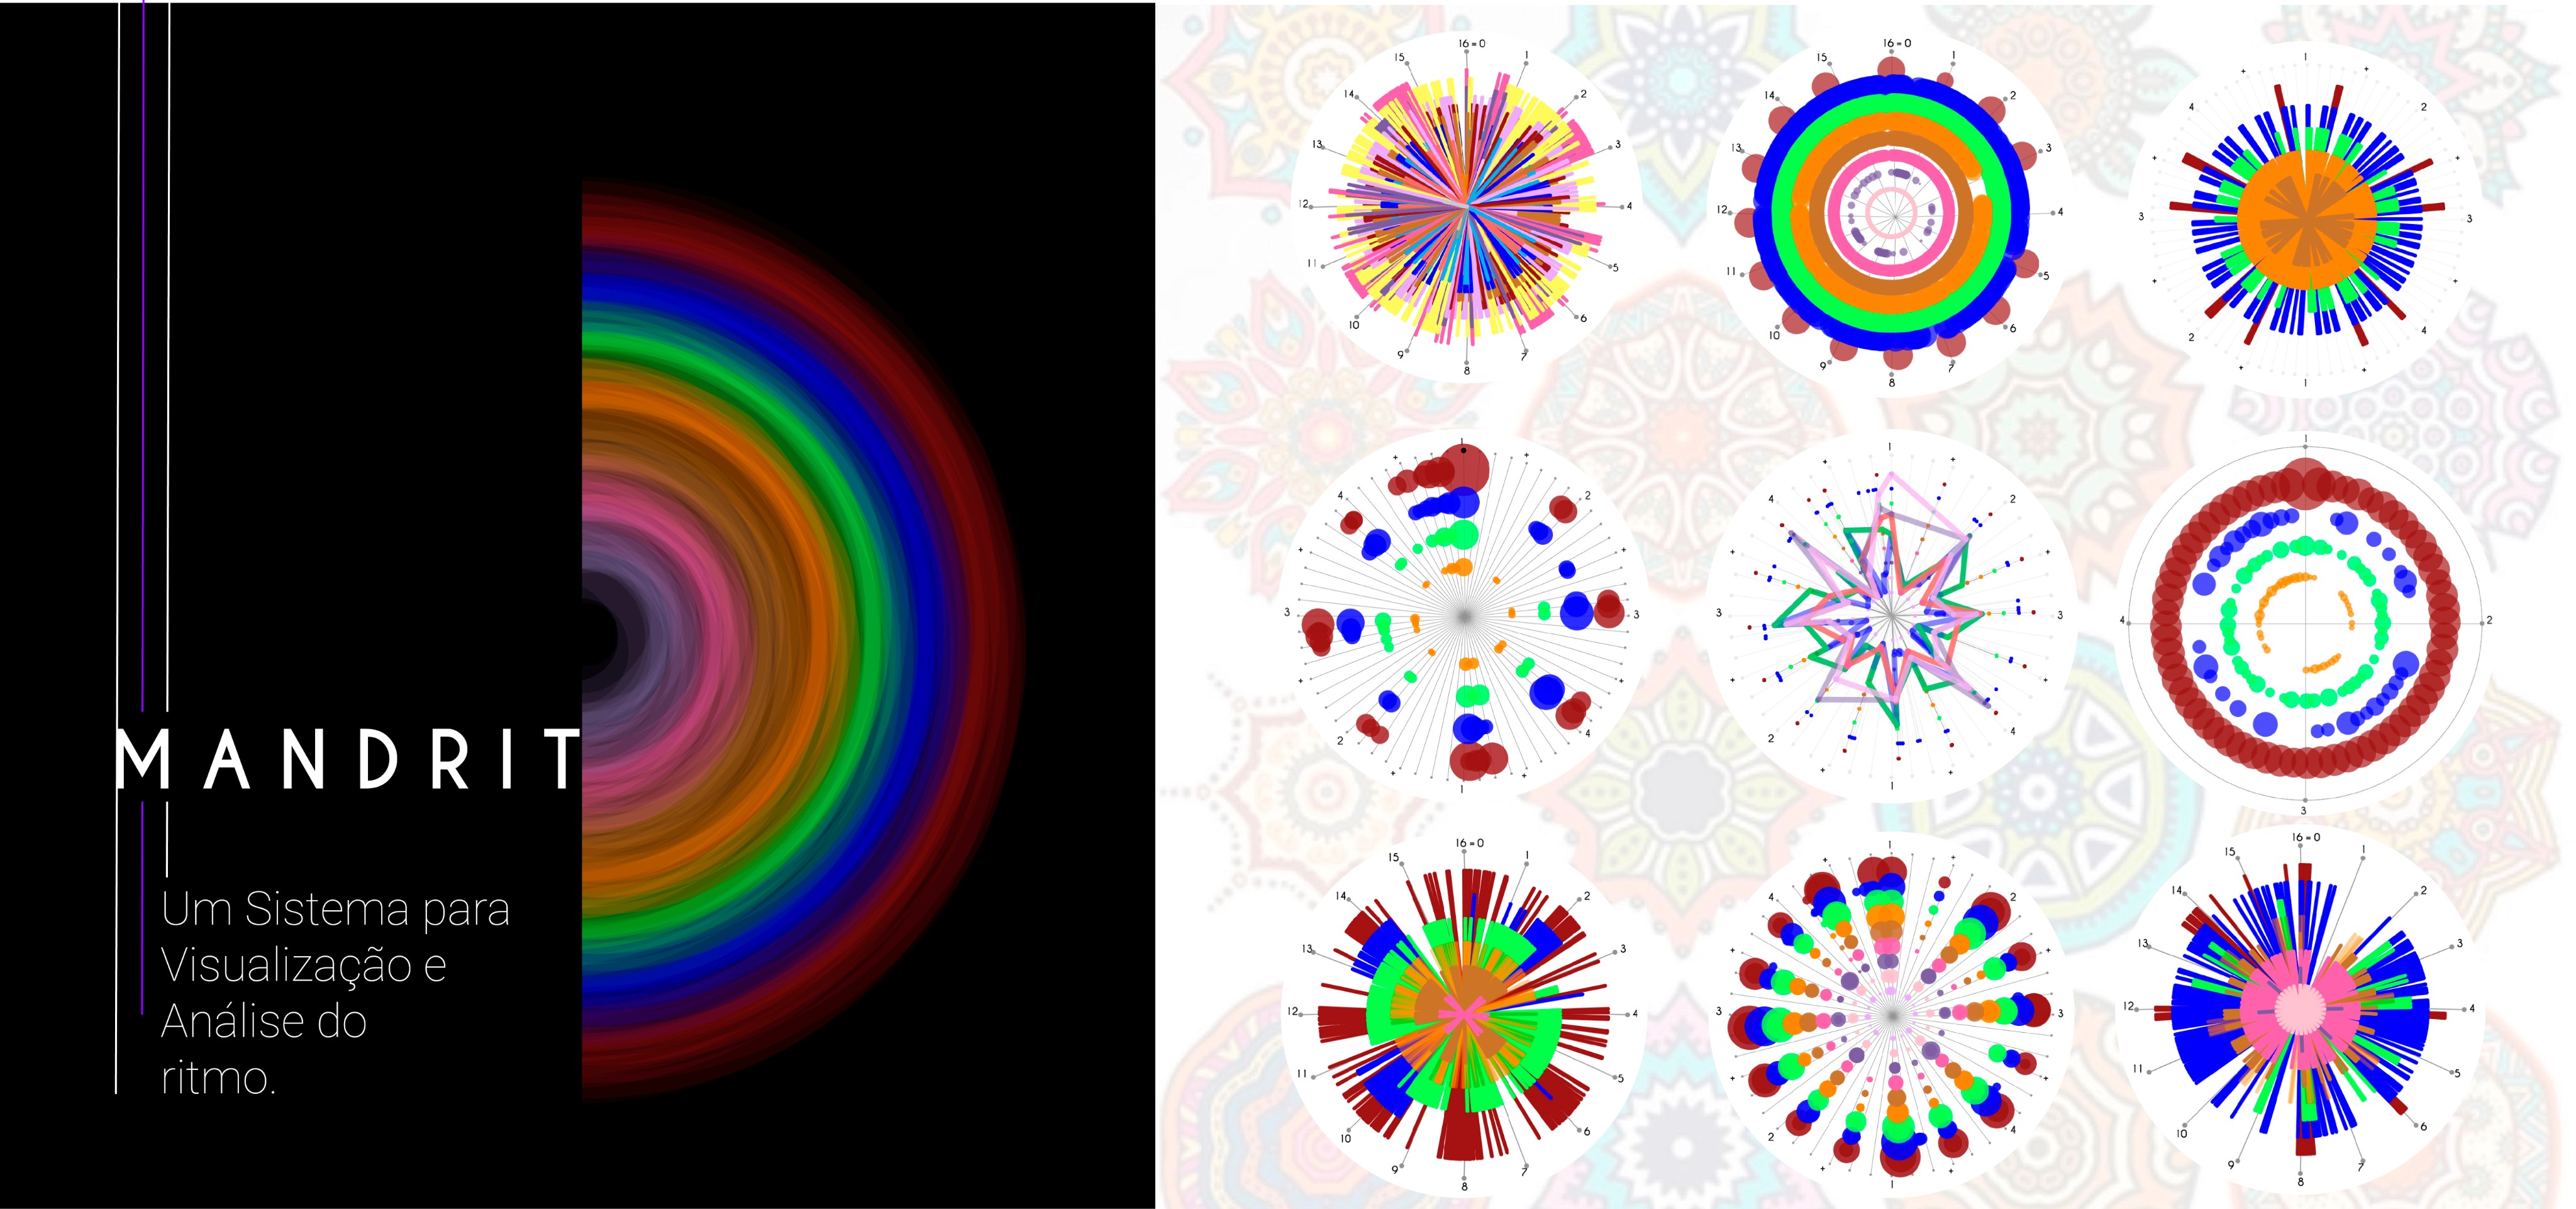
MANDRIT
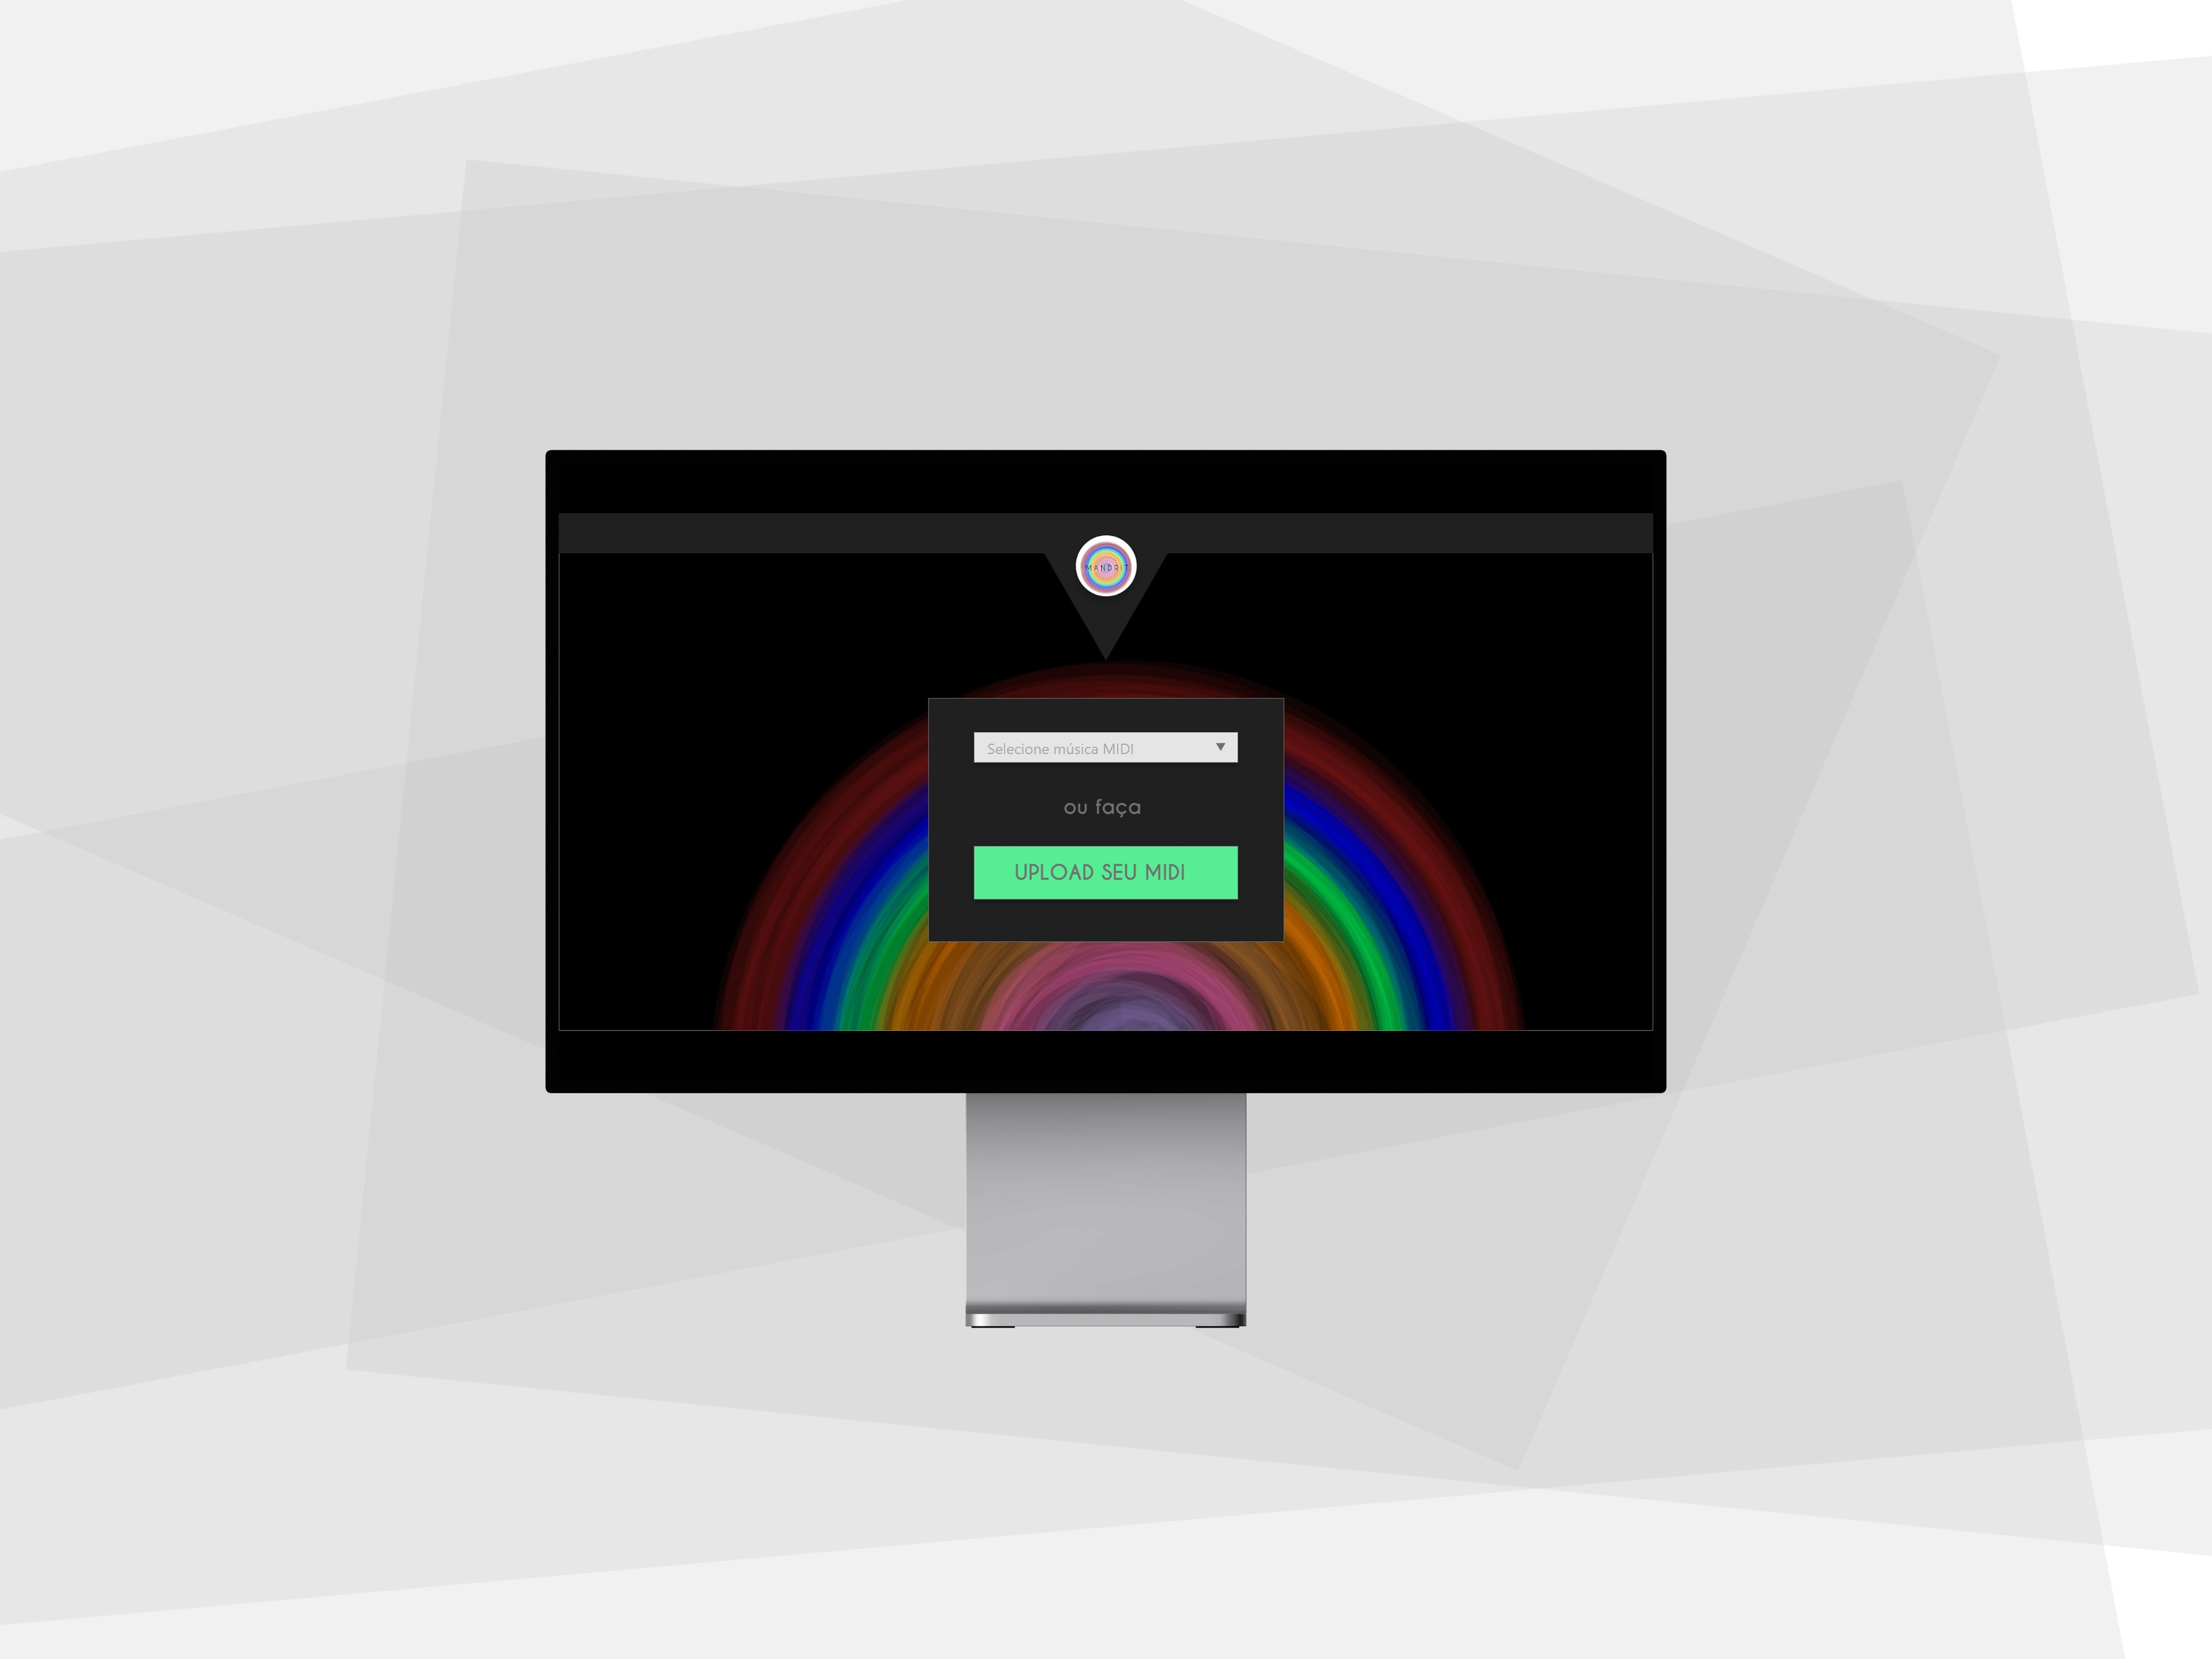
An automatic music visualization generator for rhythm analysis with MIDI music files.
SoftwareS
Adobe XD e Illustrator, Processing - p5.js
UX Research
UI
Graphic Design
Data Visualization

SKILLS
Duration Project: 2 years
Parameterization and automation of the musical analysis process with generations of graphic visualizations using MIDI data.
Collaborative work with multidisciplinary teams: Musicians, Designers, and Software Developers.
Communication with people of different profiles and mapping the pains and challenges in transcribing and visualizing musical concepts.
CHALLENGE
Have you ever heard a song and thought it was so good that you never forgot it? Have you ever tried to explain this song to someone and failed?
Mandrit is a system that emerged from focus groups of musicians and designers, analyzing abstract and complex information from music theory and music computing. Using Design Thinking and UX processes to look for ways to make these concepts more concrete, applicable and visual to facilitate the process of rhythm analysis and pattern recognition in music of different genres.
Thought-Provoking Questions
How to visually communicate musical information?
How do we automate the process of generating these visualizations?
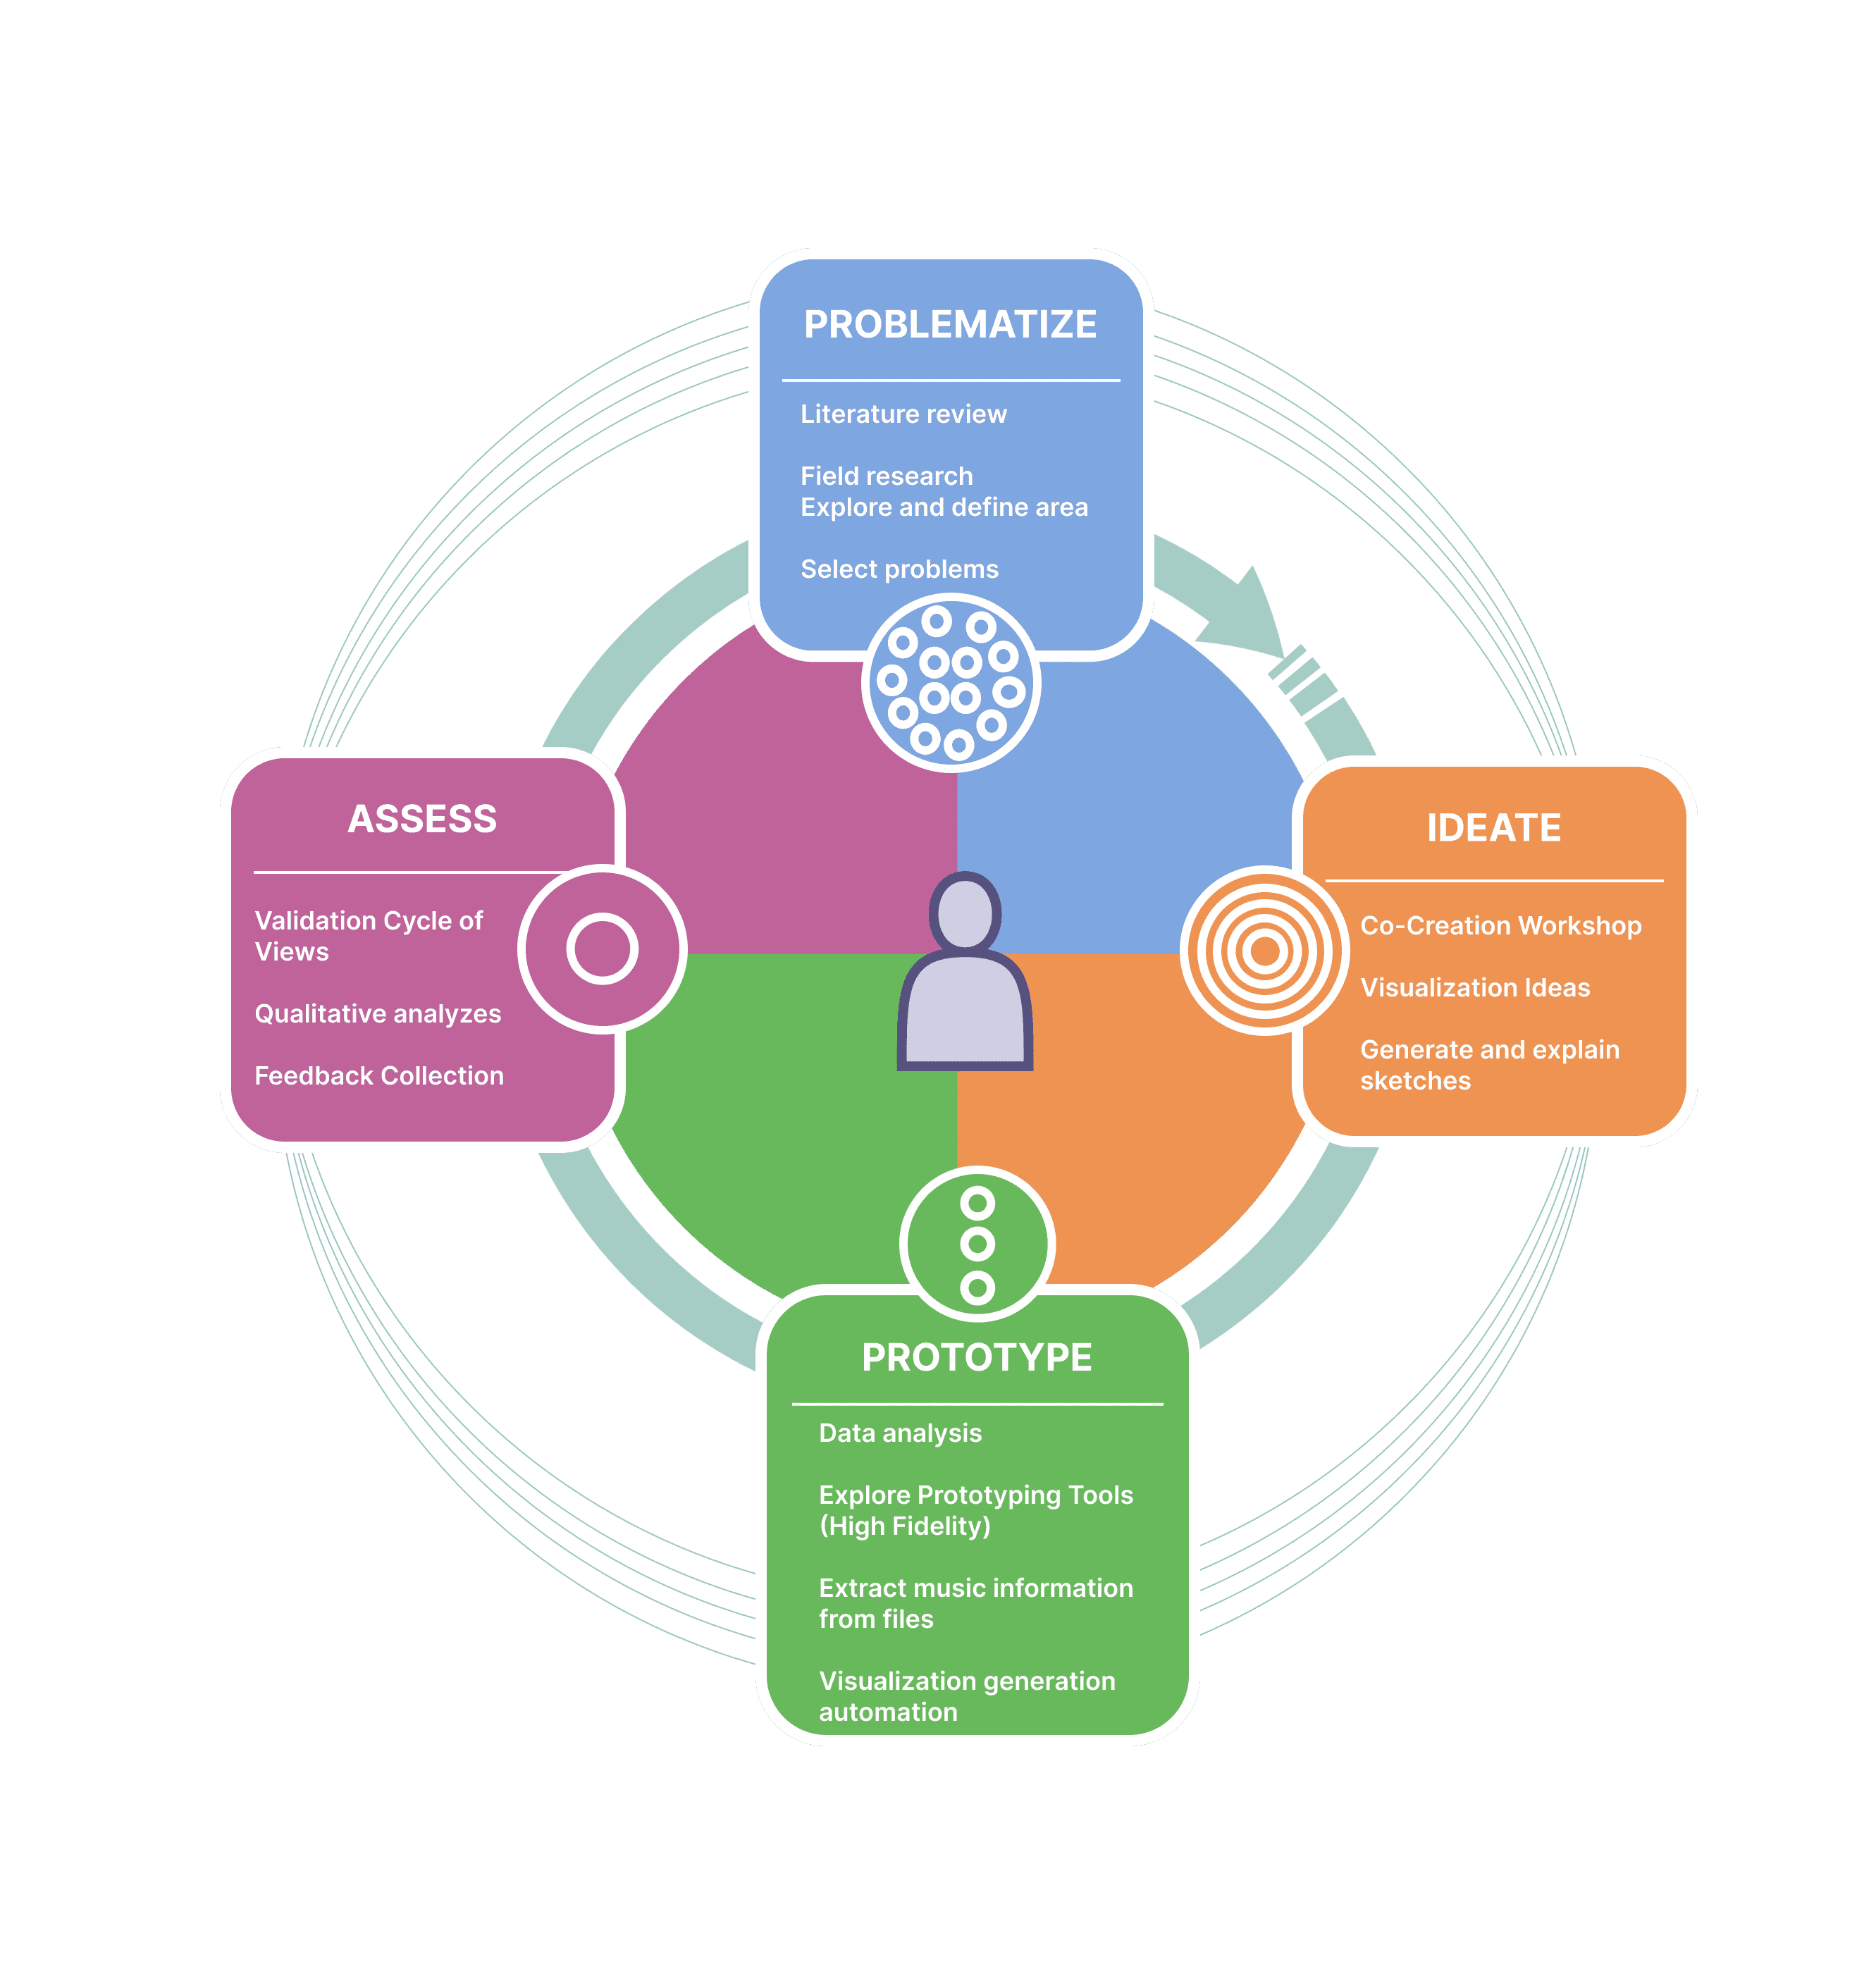
DESIGN THINKING
DEVELOPMENT
The use of Design Thinking as a guide in the development of the problem, mapping the latent pains of musical experts to the technological solution that resulted in MANDRIT, a system generator of graphic visualizations with rhythmic signatures of different kinds of music.
Contact: name@email.com

A project with MUSTIC as UX RESEARCH for system development
MANDRIT
An automated system for generating musical visualizations for Rhythm analysis.
Technical Papers SBCM 2021
IDEATE
We have explored tools to generate musical visualizations, as a means to help musicians and students in musical analysis, teaching, composing, and complementing musical performances.
DISCOVERY
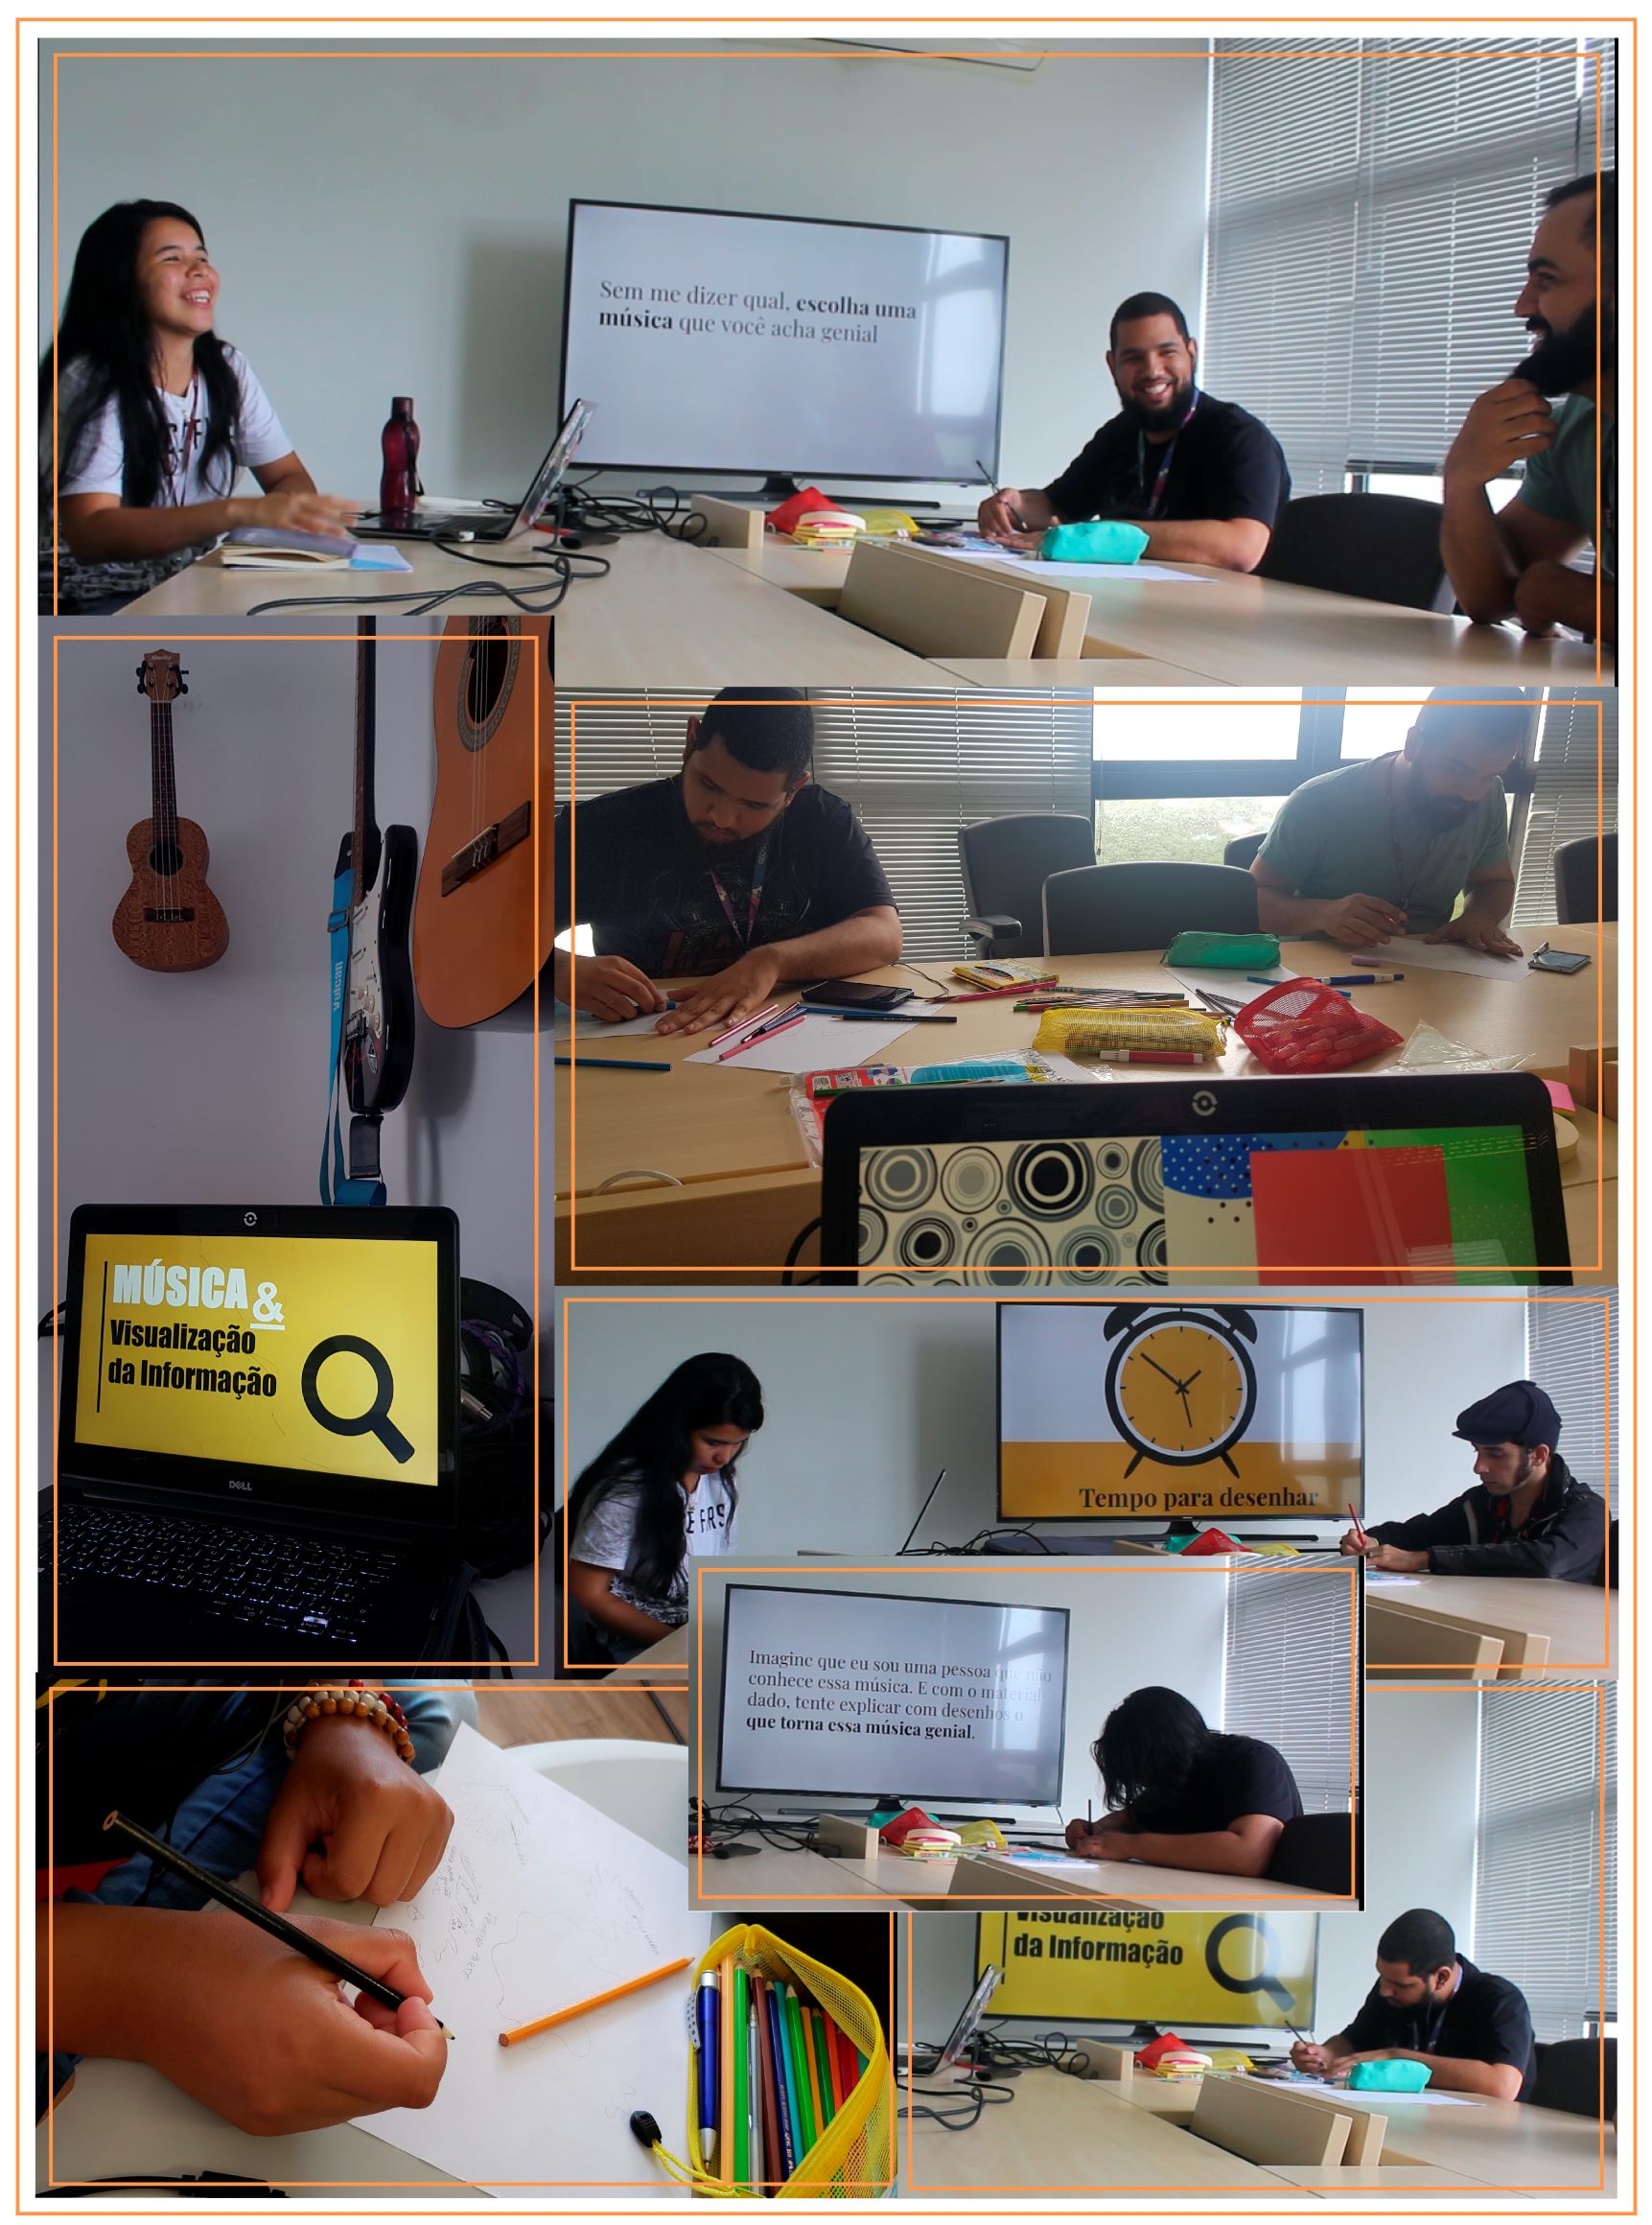
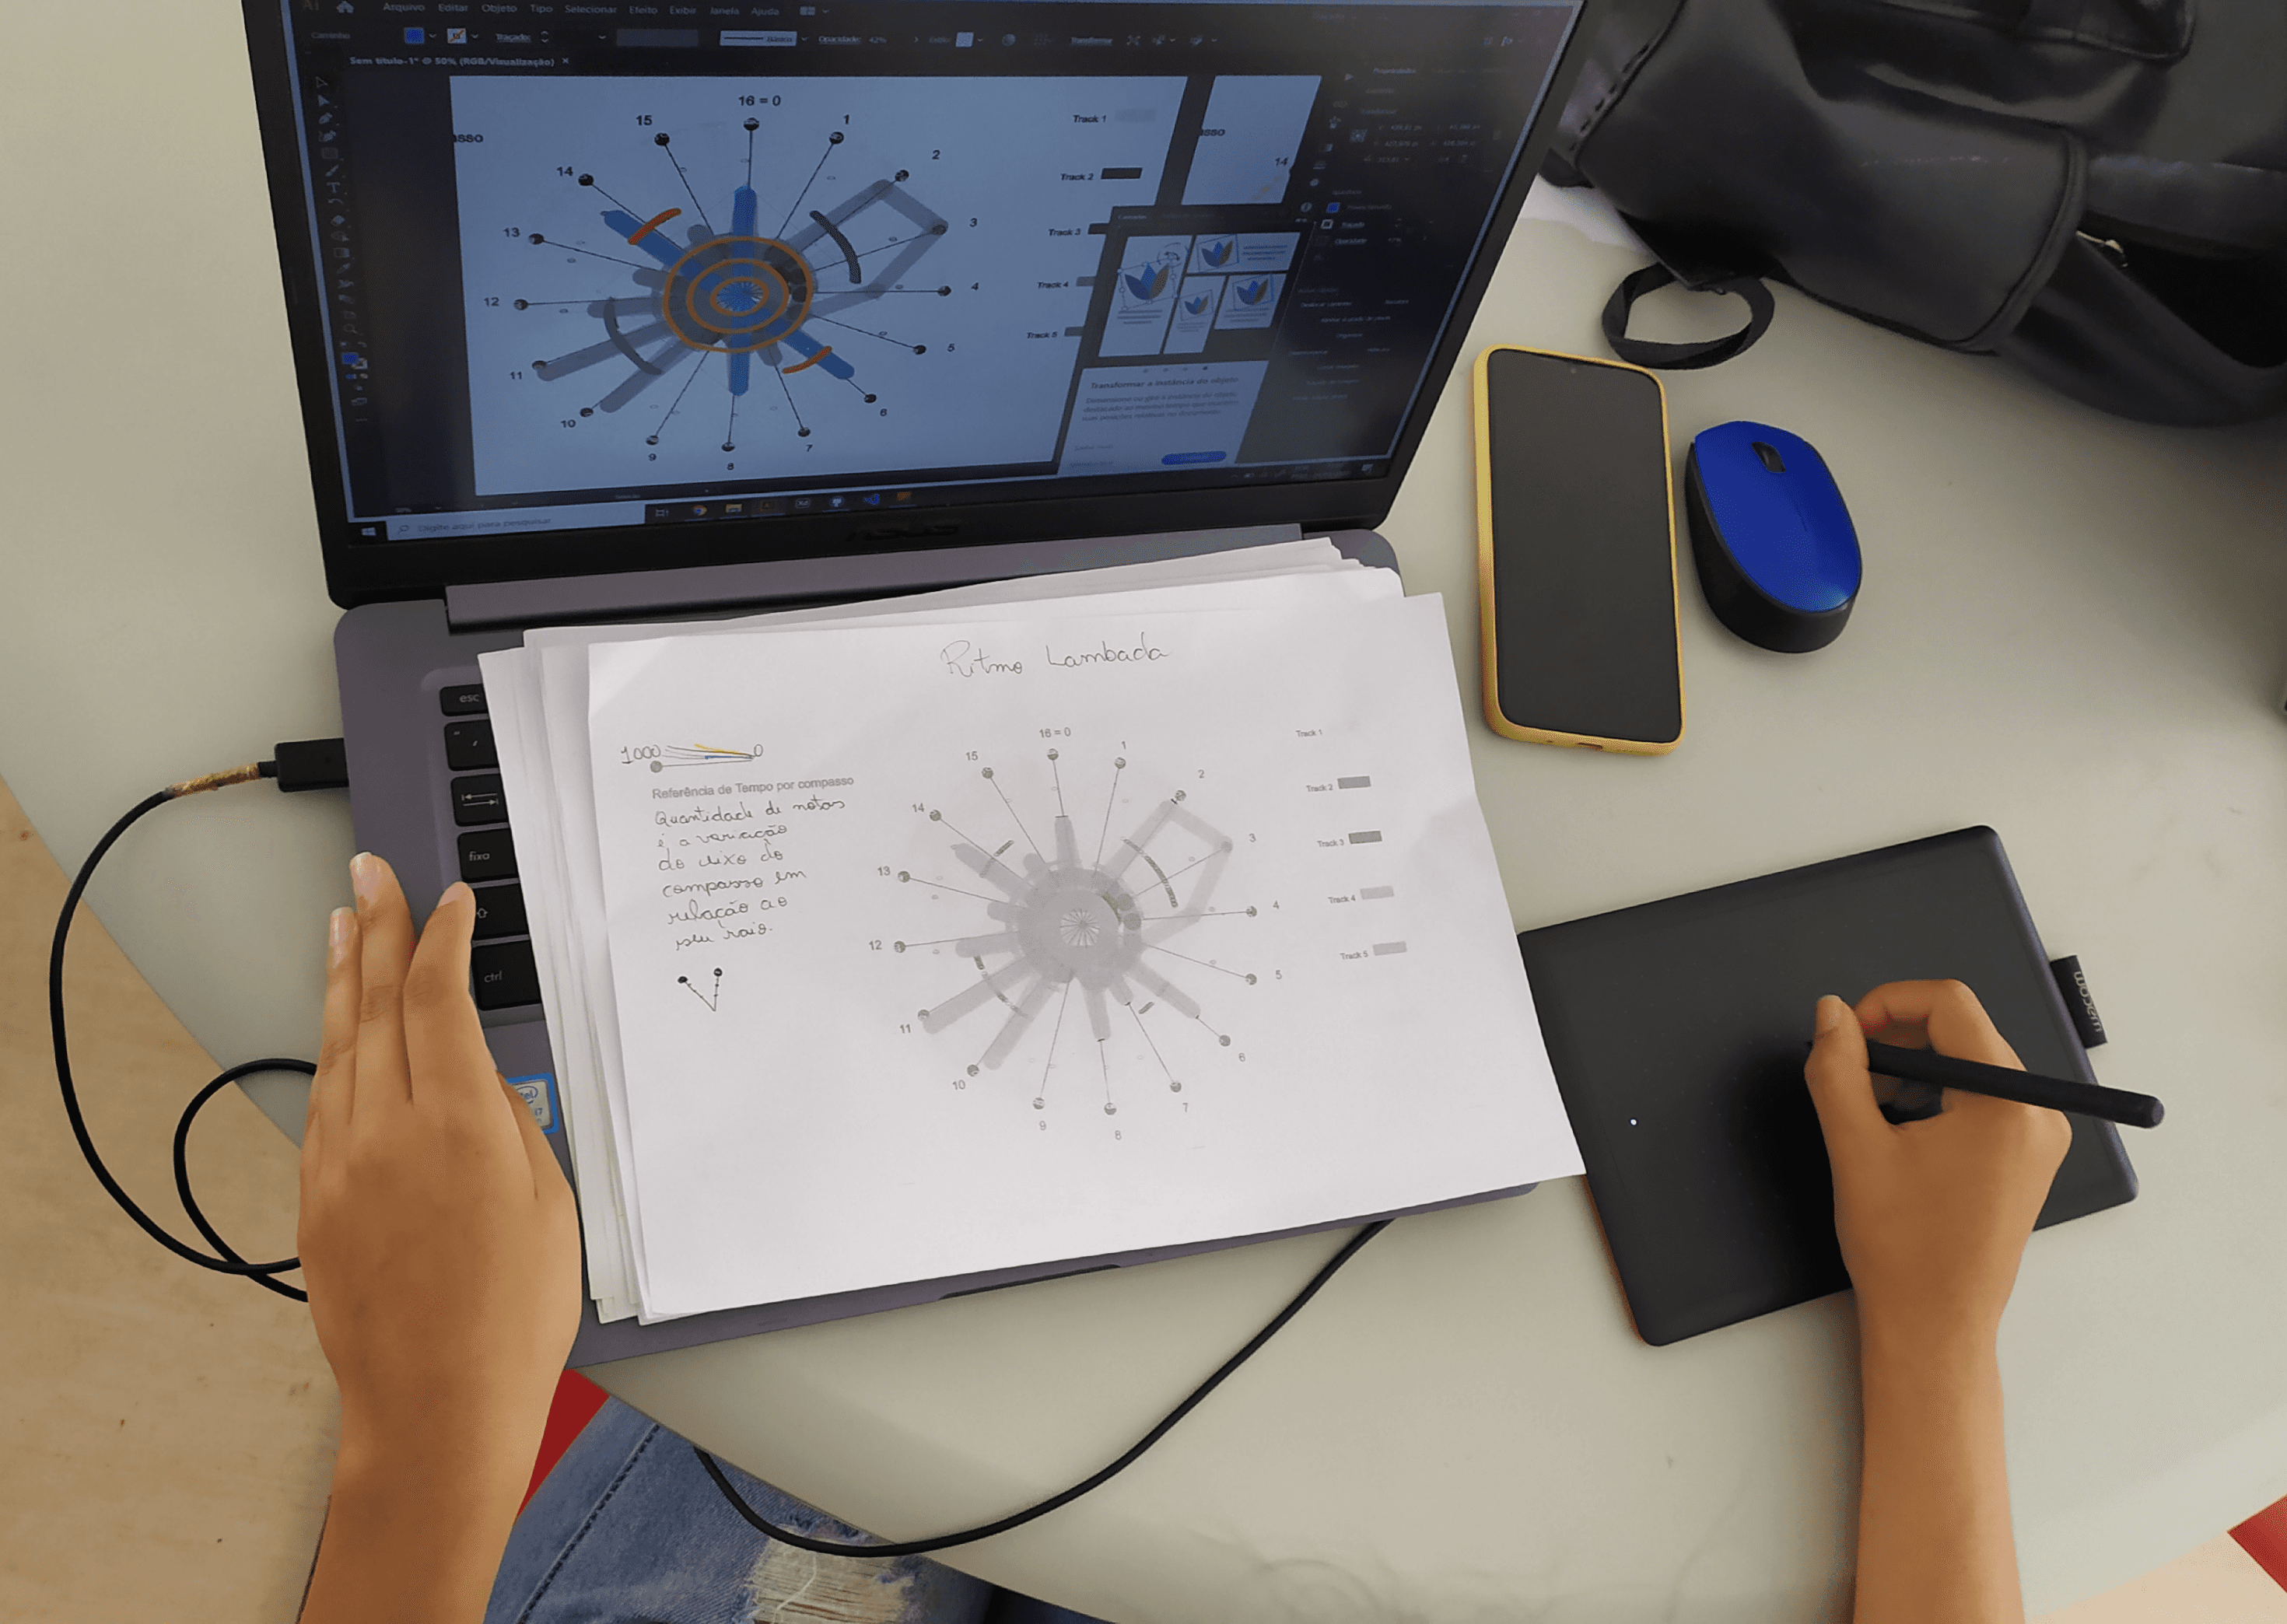
Exploratory sessions: In-depth interviews, observation of the experiment participants, and analysis of different perceptions about the problem.
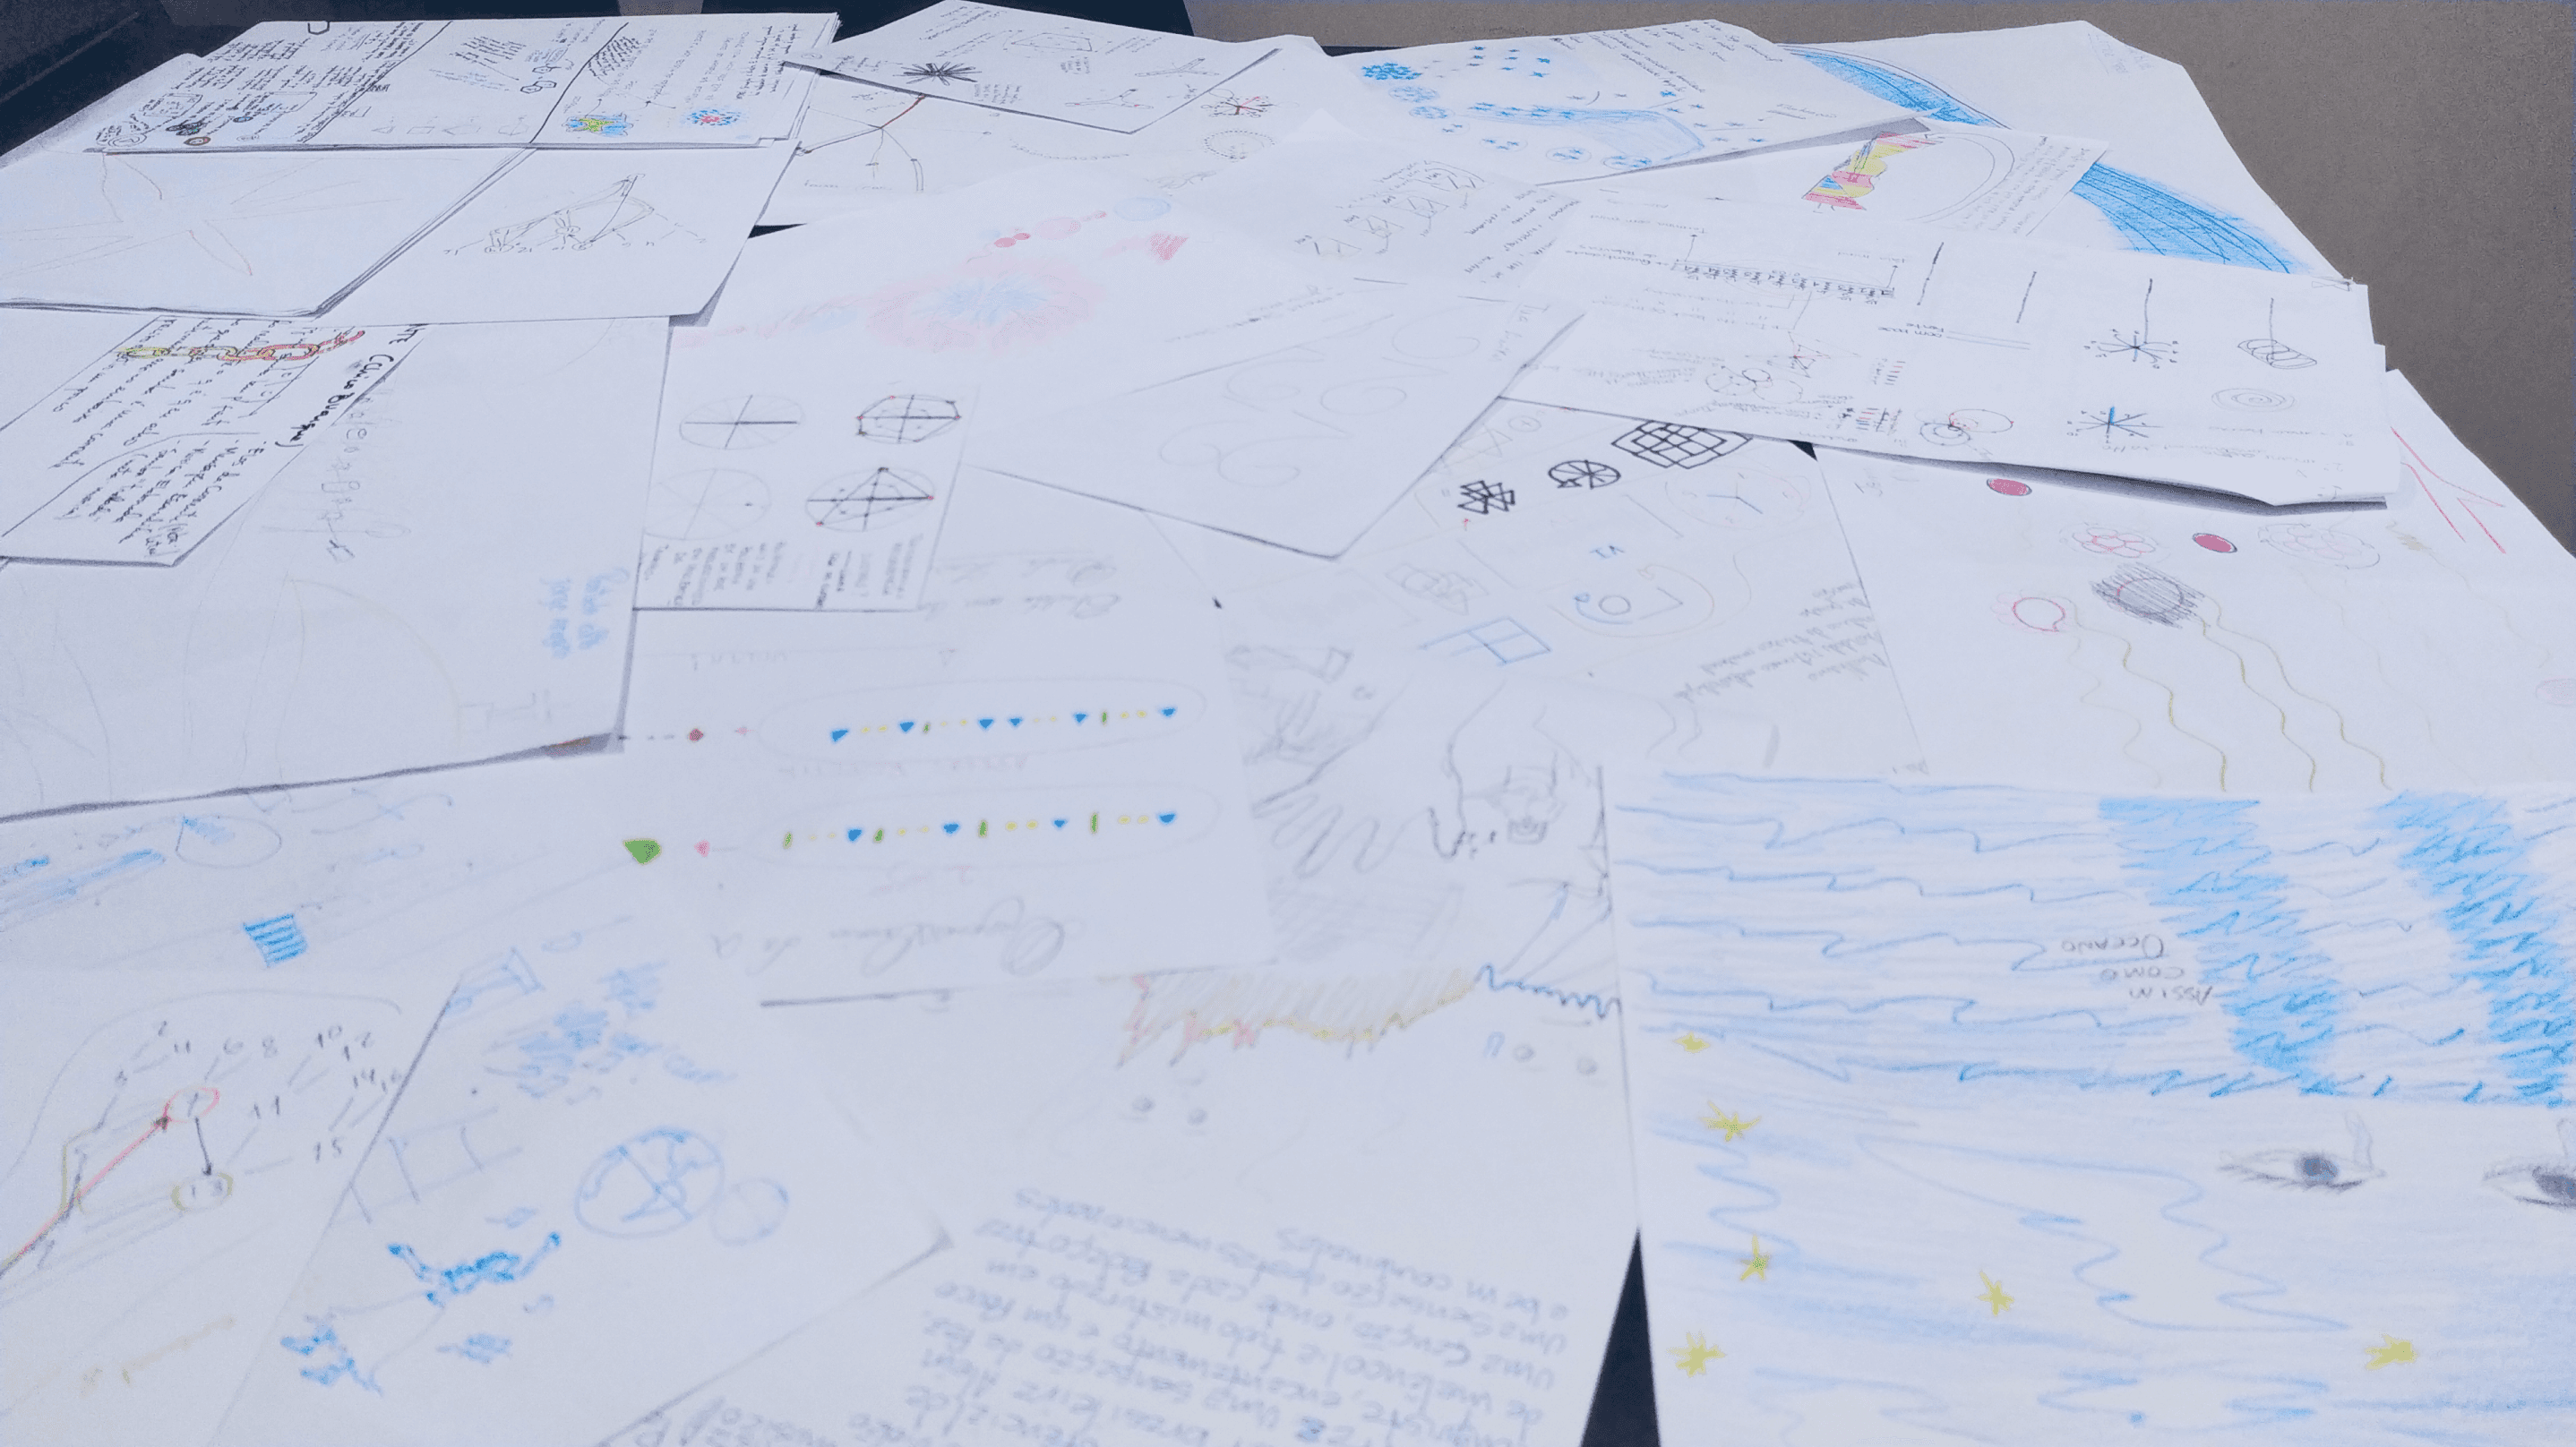
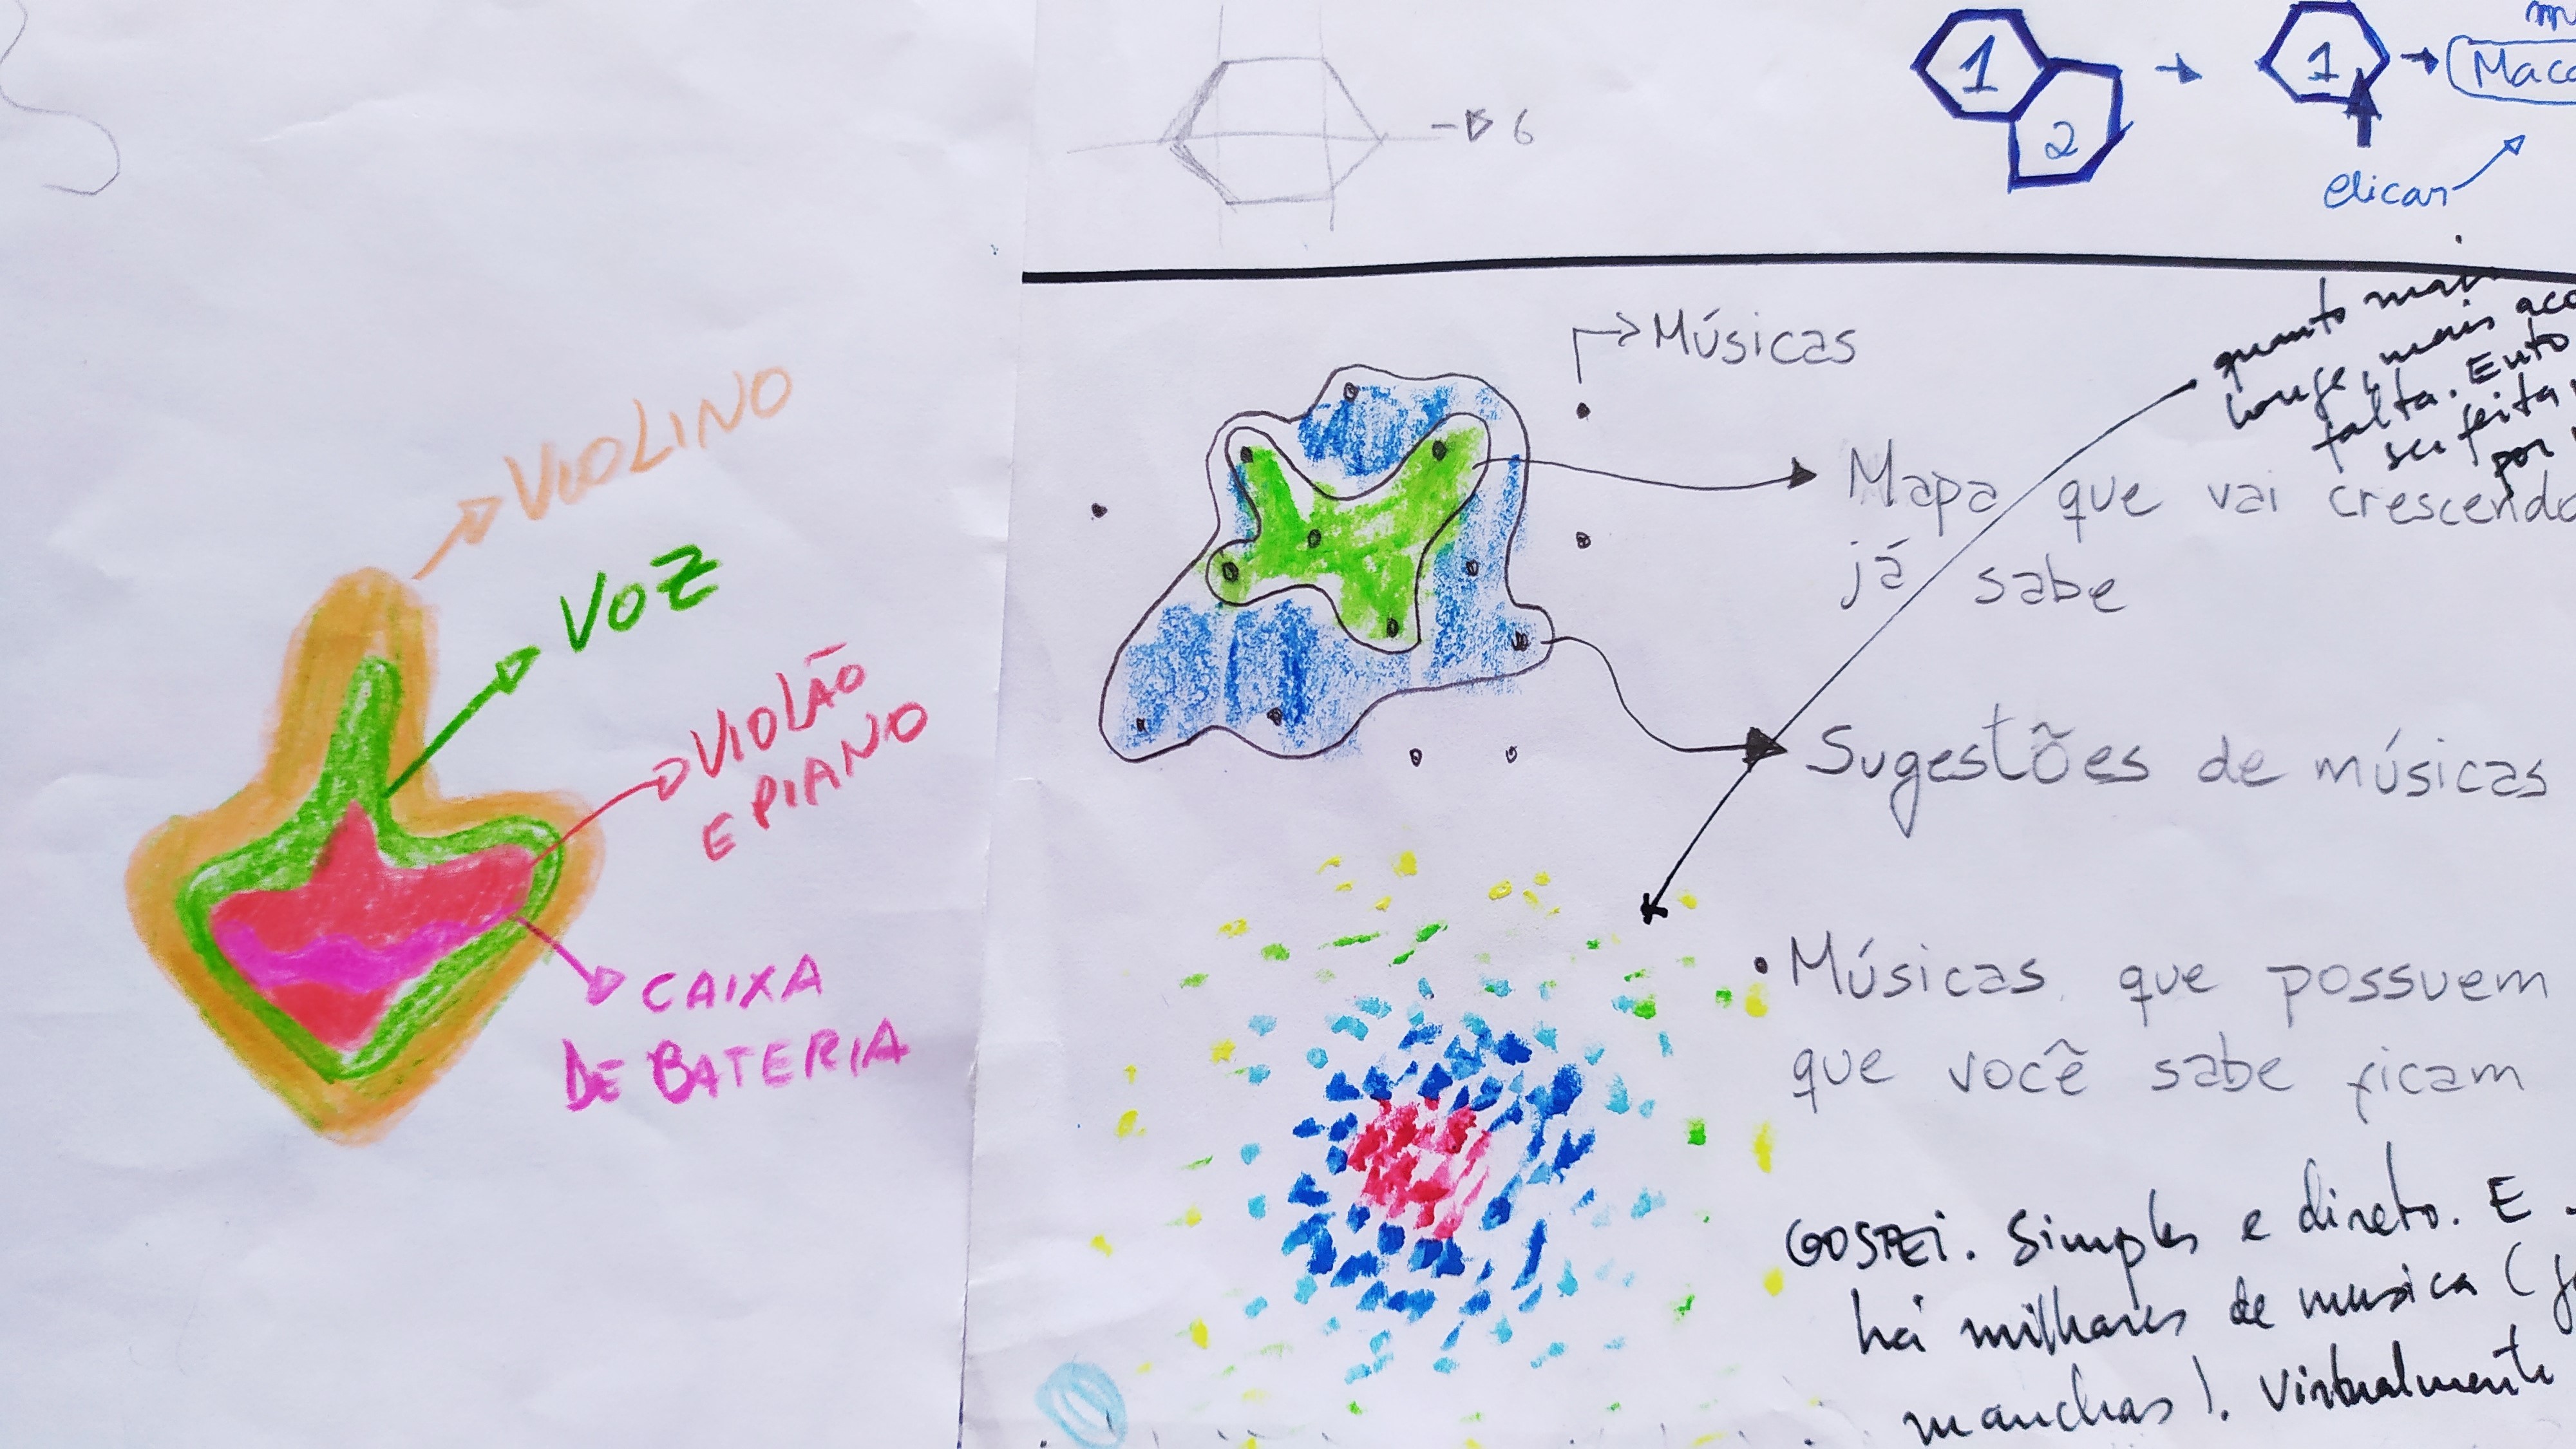
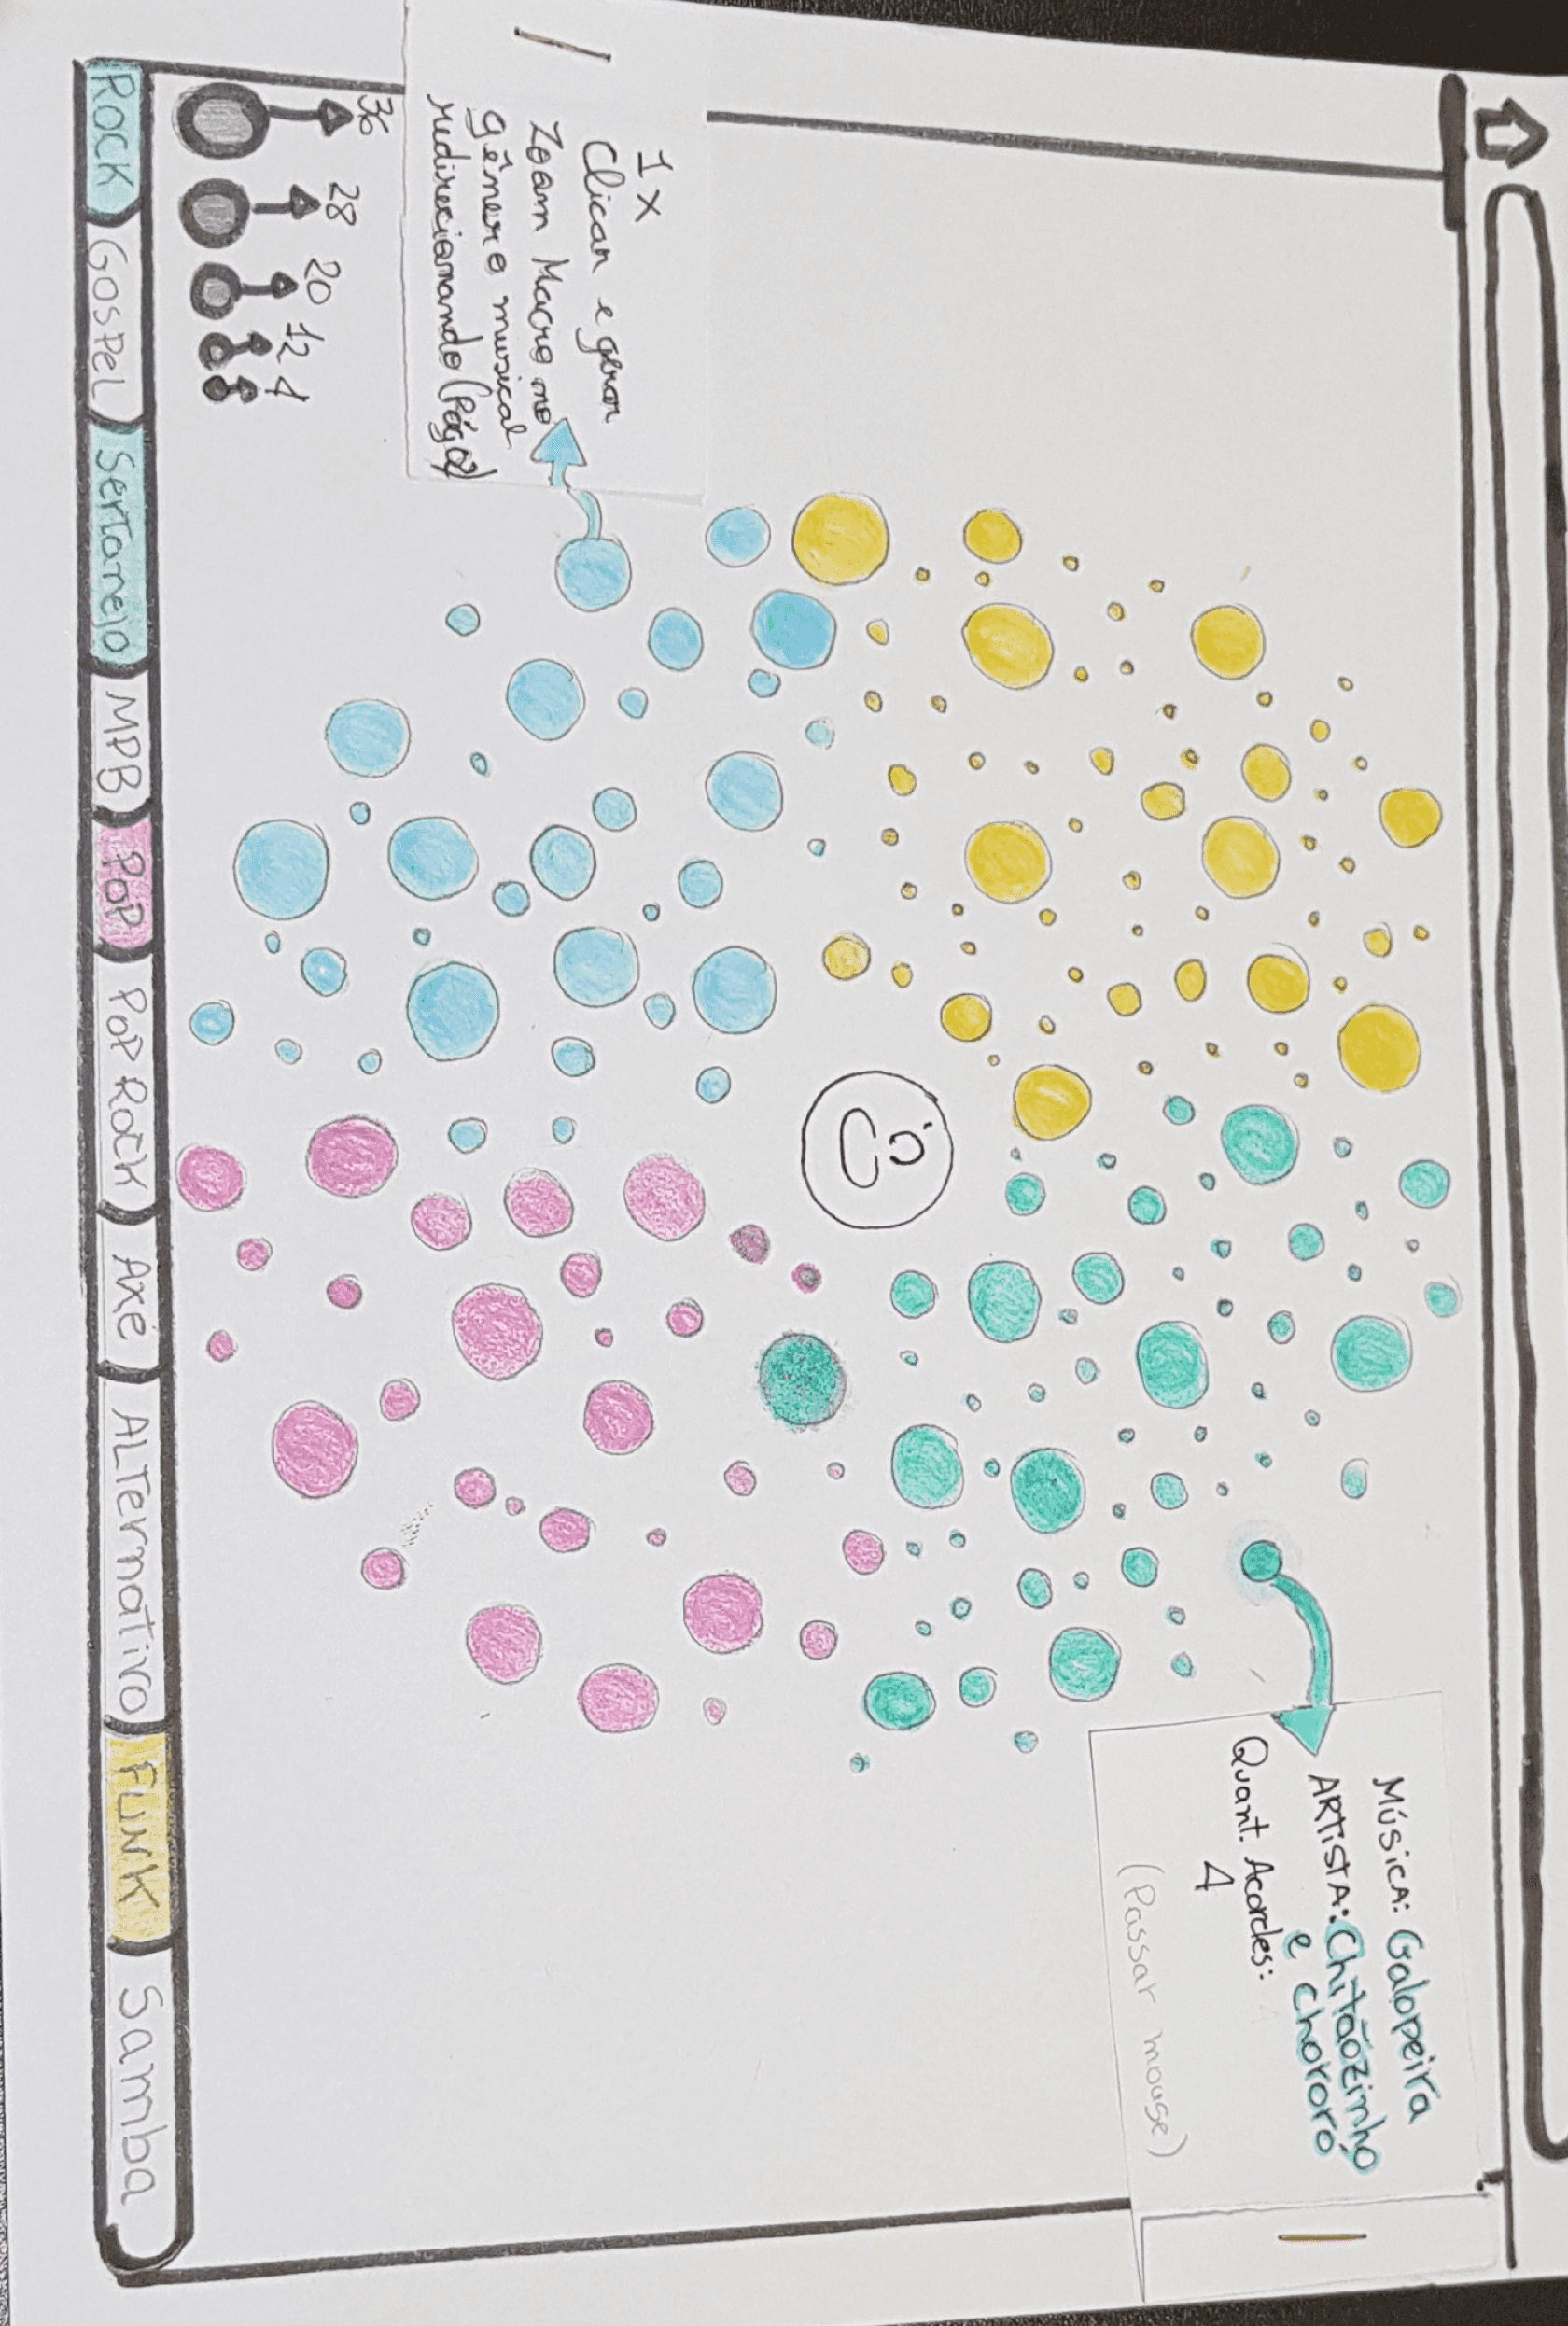
The experiment: In a controlled environment with time, and focus on ideation, the challenge for the participant involved choosing a song and describing the musical genre. In the second stage, the participant drew the selected song on an A4 sheet of paper (framer for the static signature of the song) and at the end they explain their visual analysis for collecting emotional data such as feelings, points of view and experiences.
INSIGHTS
What kinds of visualizations do we want and can create?
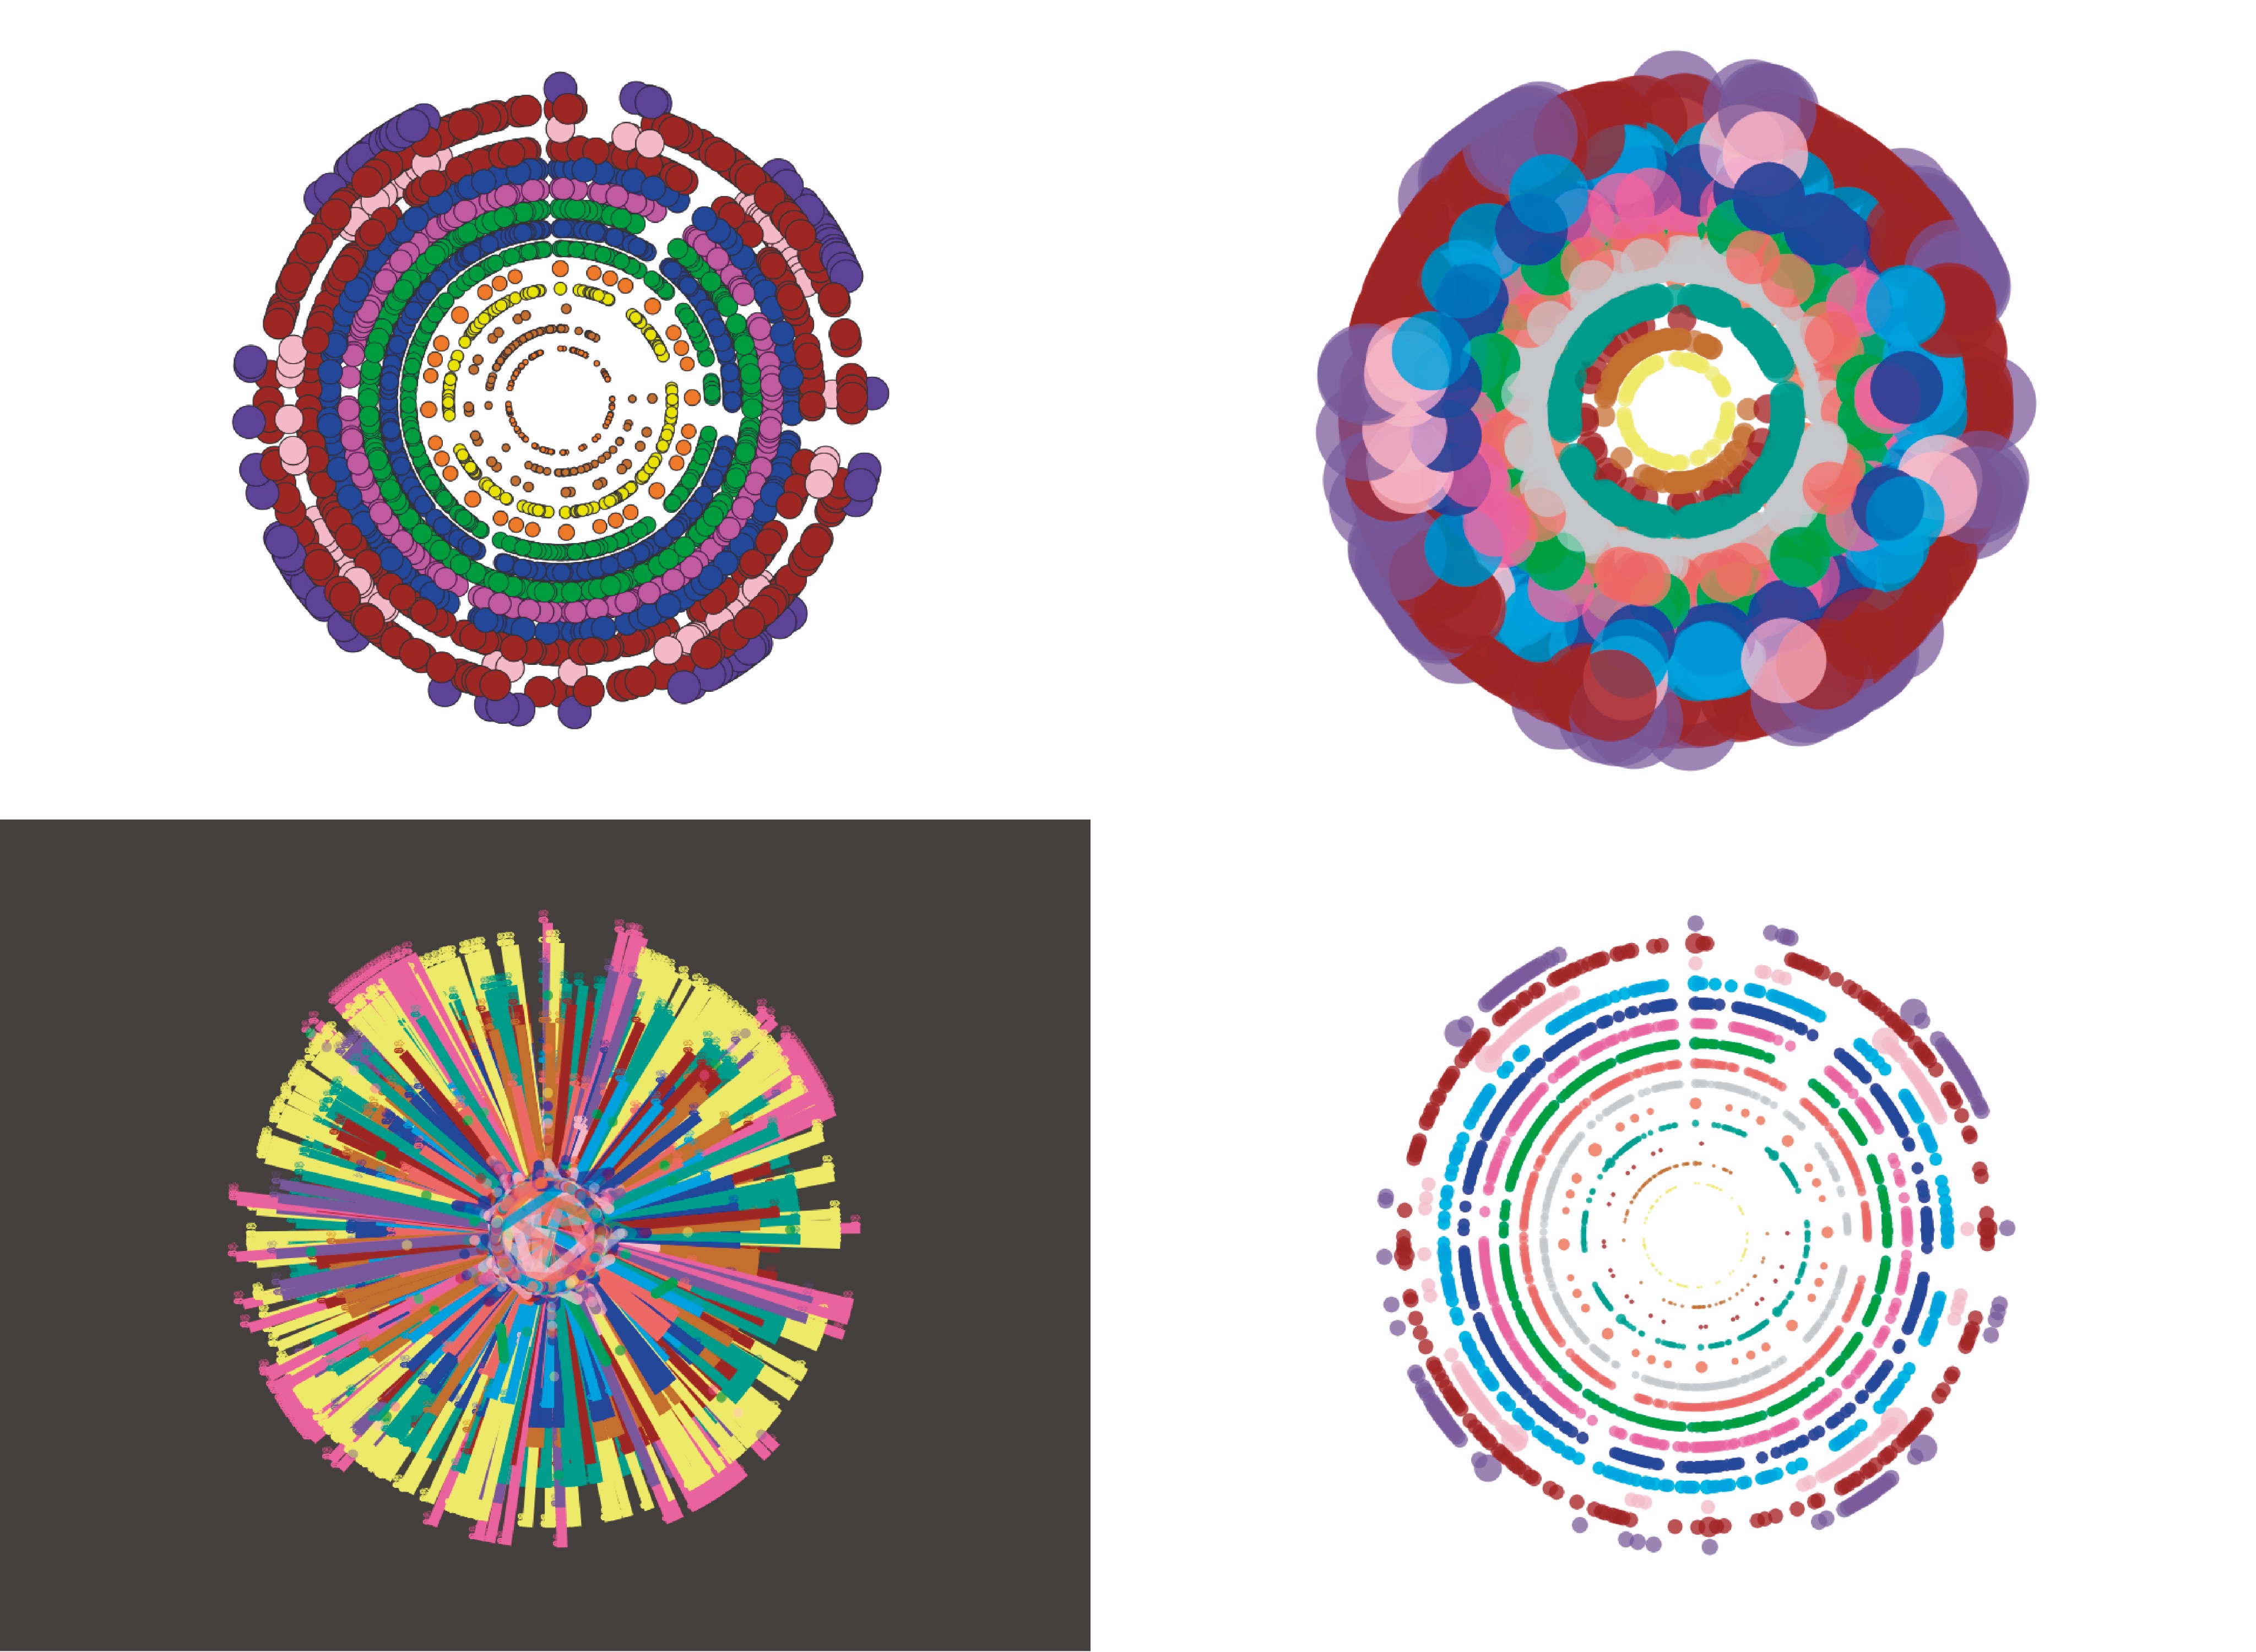
Static visualizations and musical signatures that combine all music information in a single frame.
Views generating profile
With the experiment, we defined the personas to carry out the tests and generate visualizations with Mandrit. They would be technical profiles, expert musicians, and designers.
Who will analyze the graphic results?
Anyone interested in learning about musical concepts, anyone who wants to explain musical concepts they find interesting, for educational purposes by exploring songs visually.
UX RESEARCH PROCESS
Preparation and Application of Experimental Protocol
Including Brainstorming, 6-3-5 method, CSD matrix.
Co-creation workshop
Practical immersion in the problem
Personas experts (musicians, visual artists, and designers)
Mapping feelings and thinking about music through sketches and creating visualizations.
PROTOTYPE
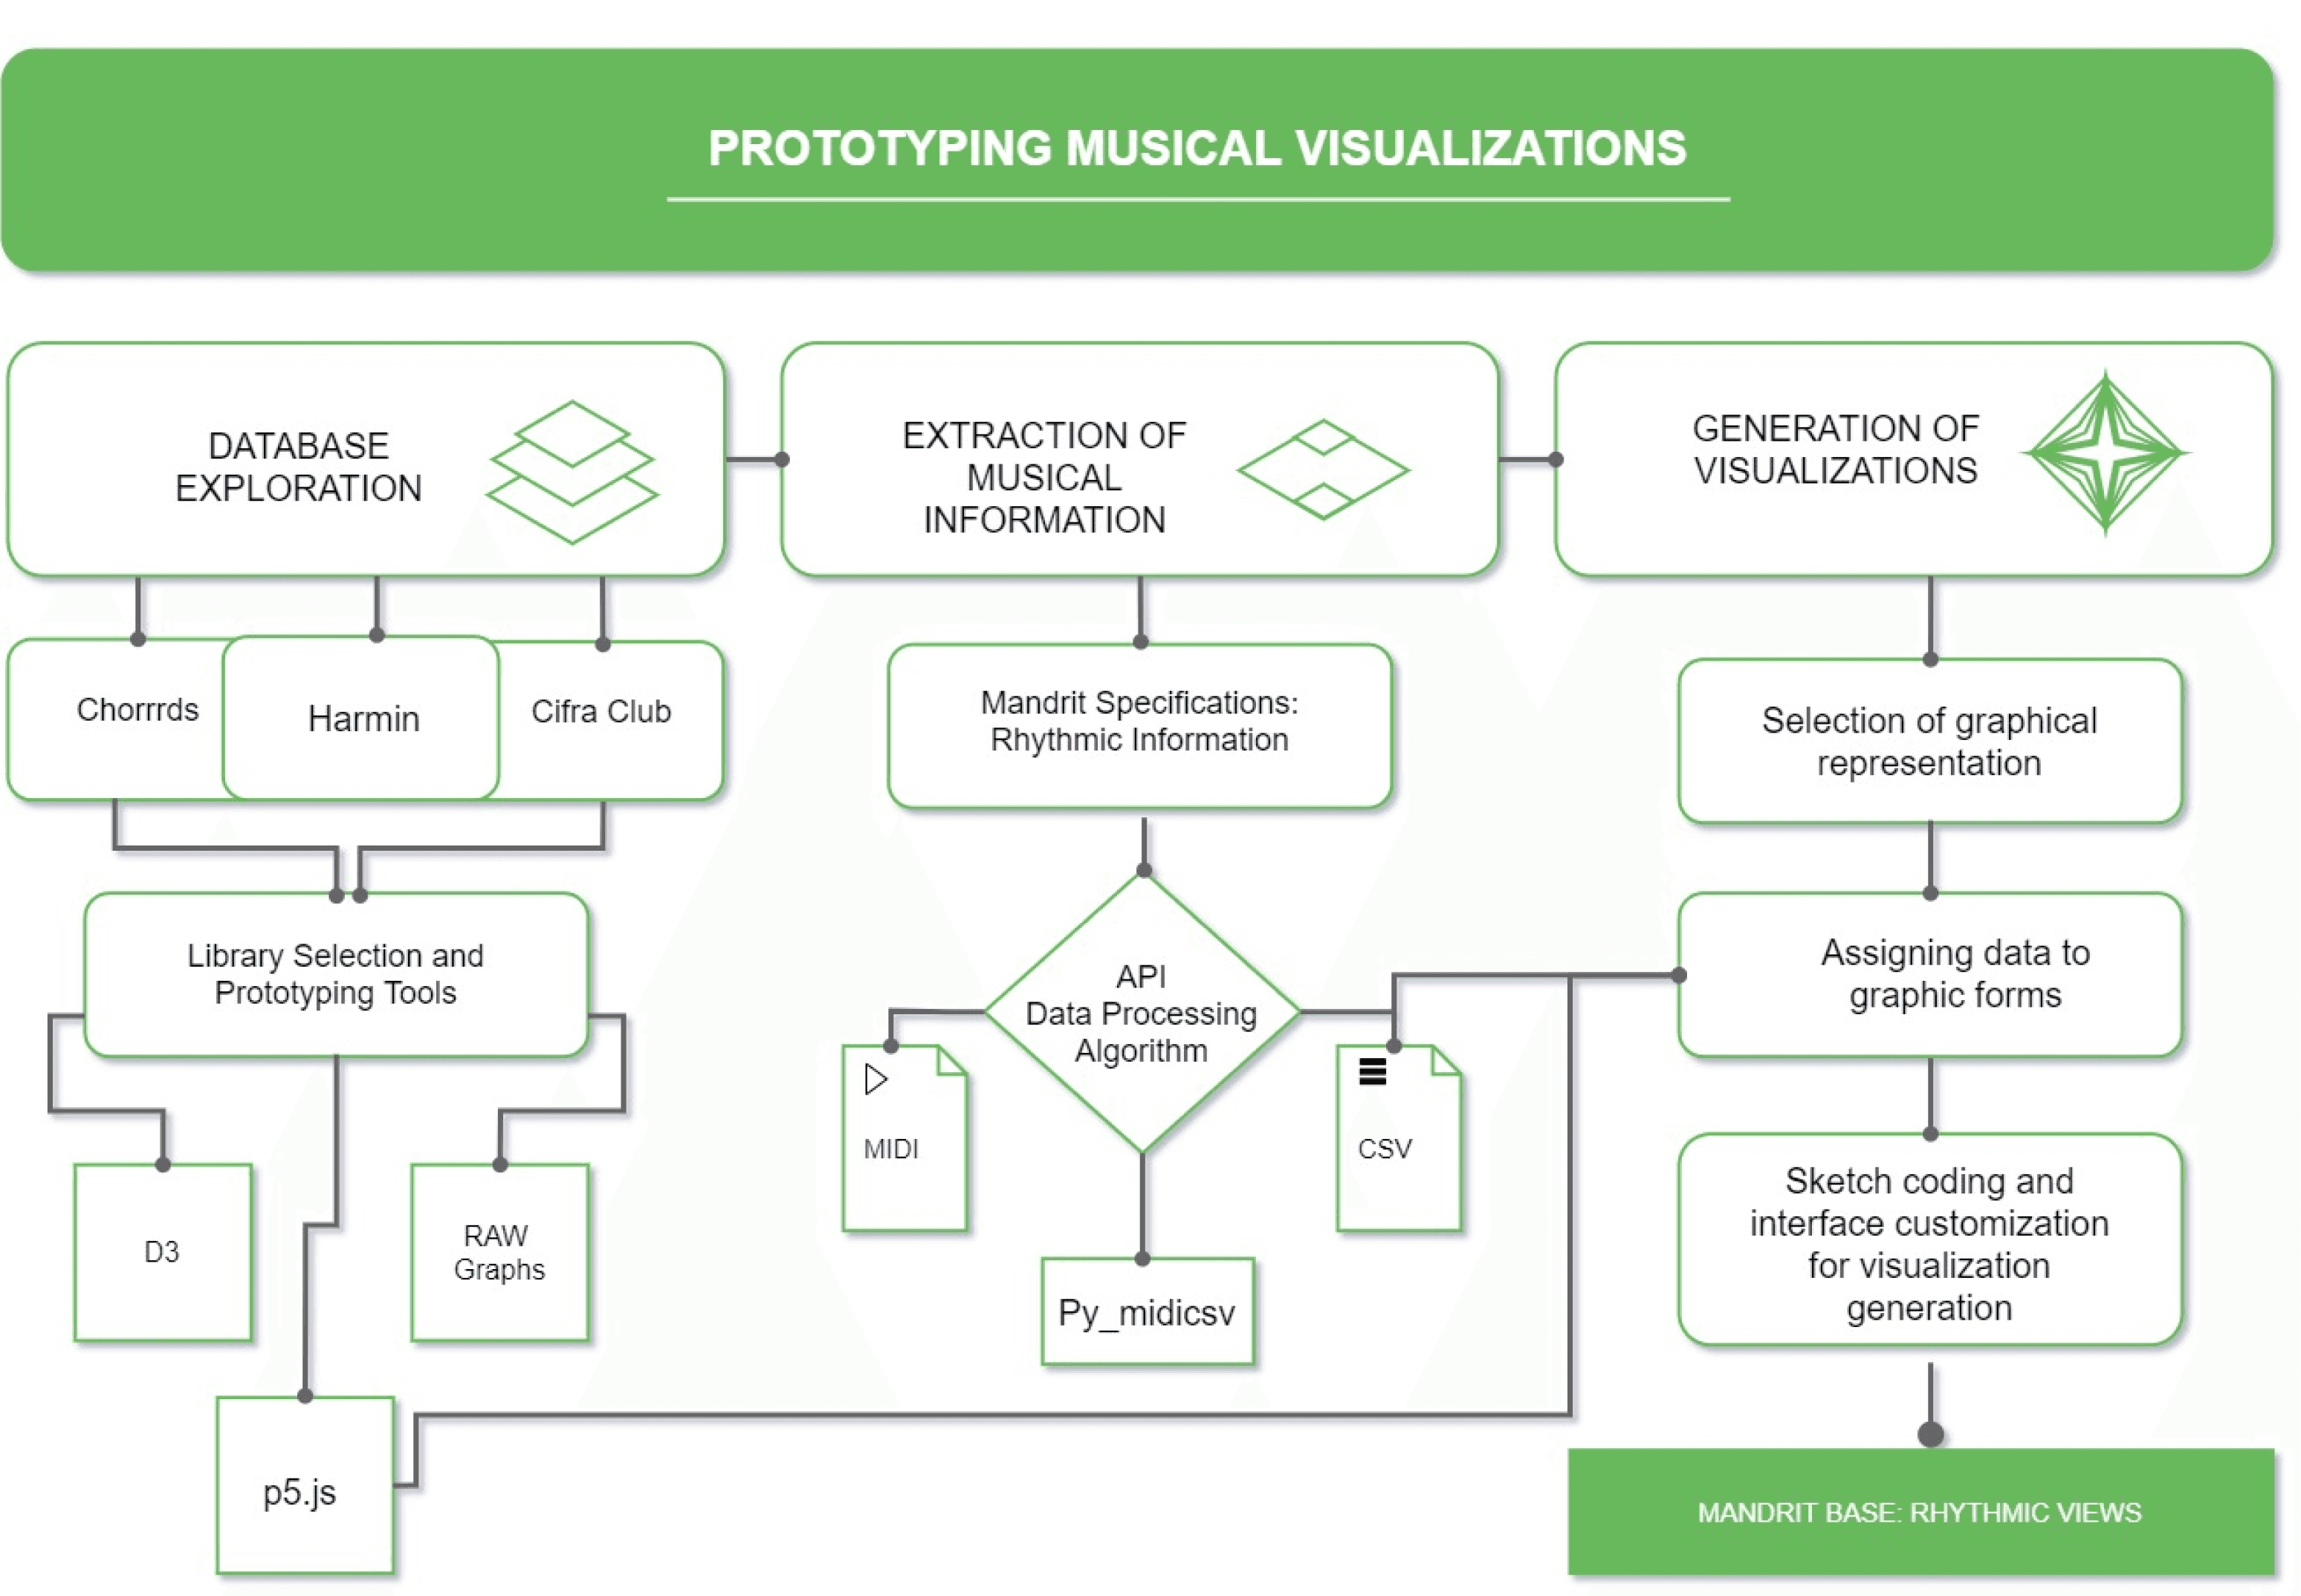
Creation of Roadmap Database. Conducting benchmarking research to gather insights and ongoing testing with music and visual experts. Particularly at this stage, we work with the development team to align, process, and extract music data to generate music visualizations and dashboards.
Mid-fidelity prototypes
DESIGN AND PROTOTYPING
Insight collection
Visual experiments
Product creation, interaction
Interface development
Data analysis
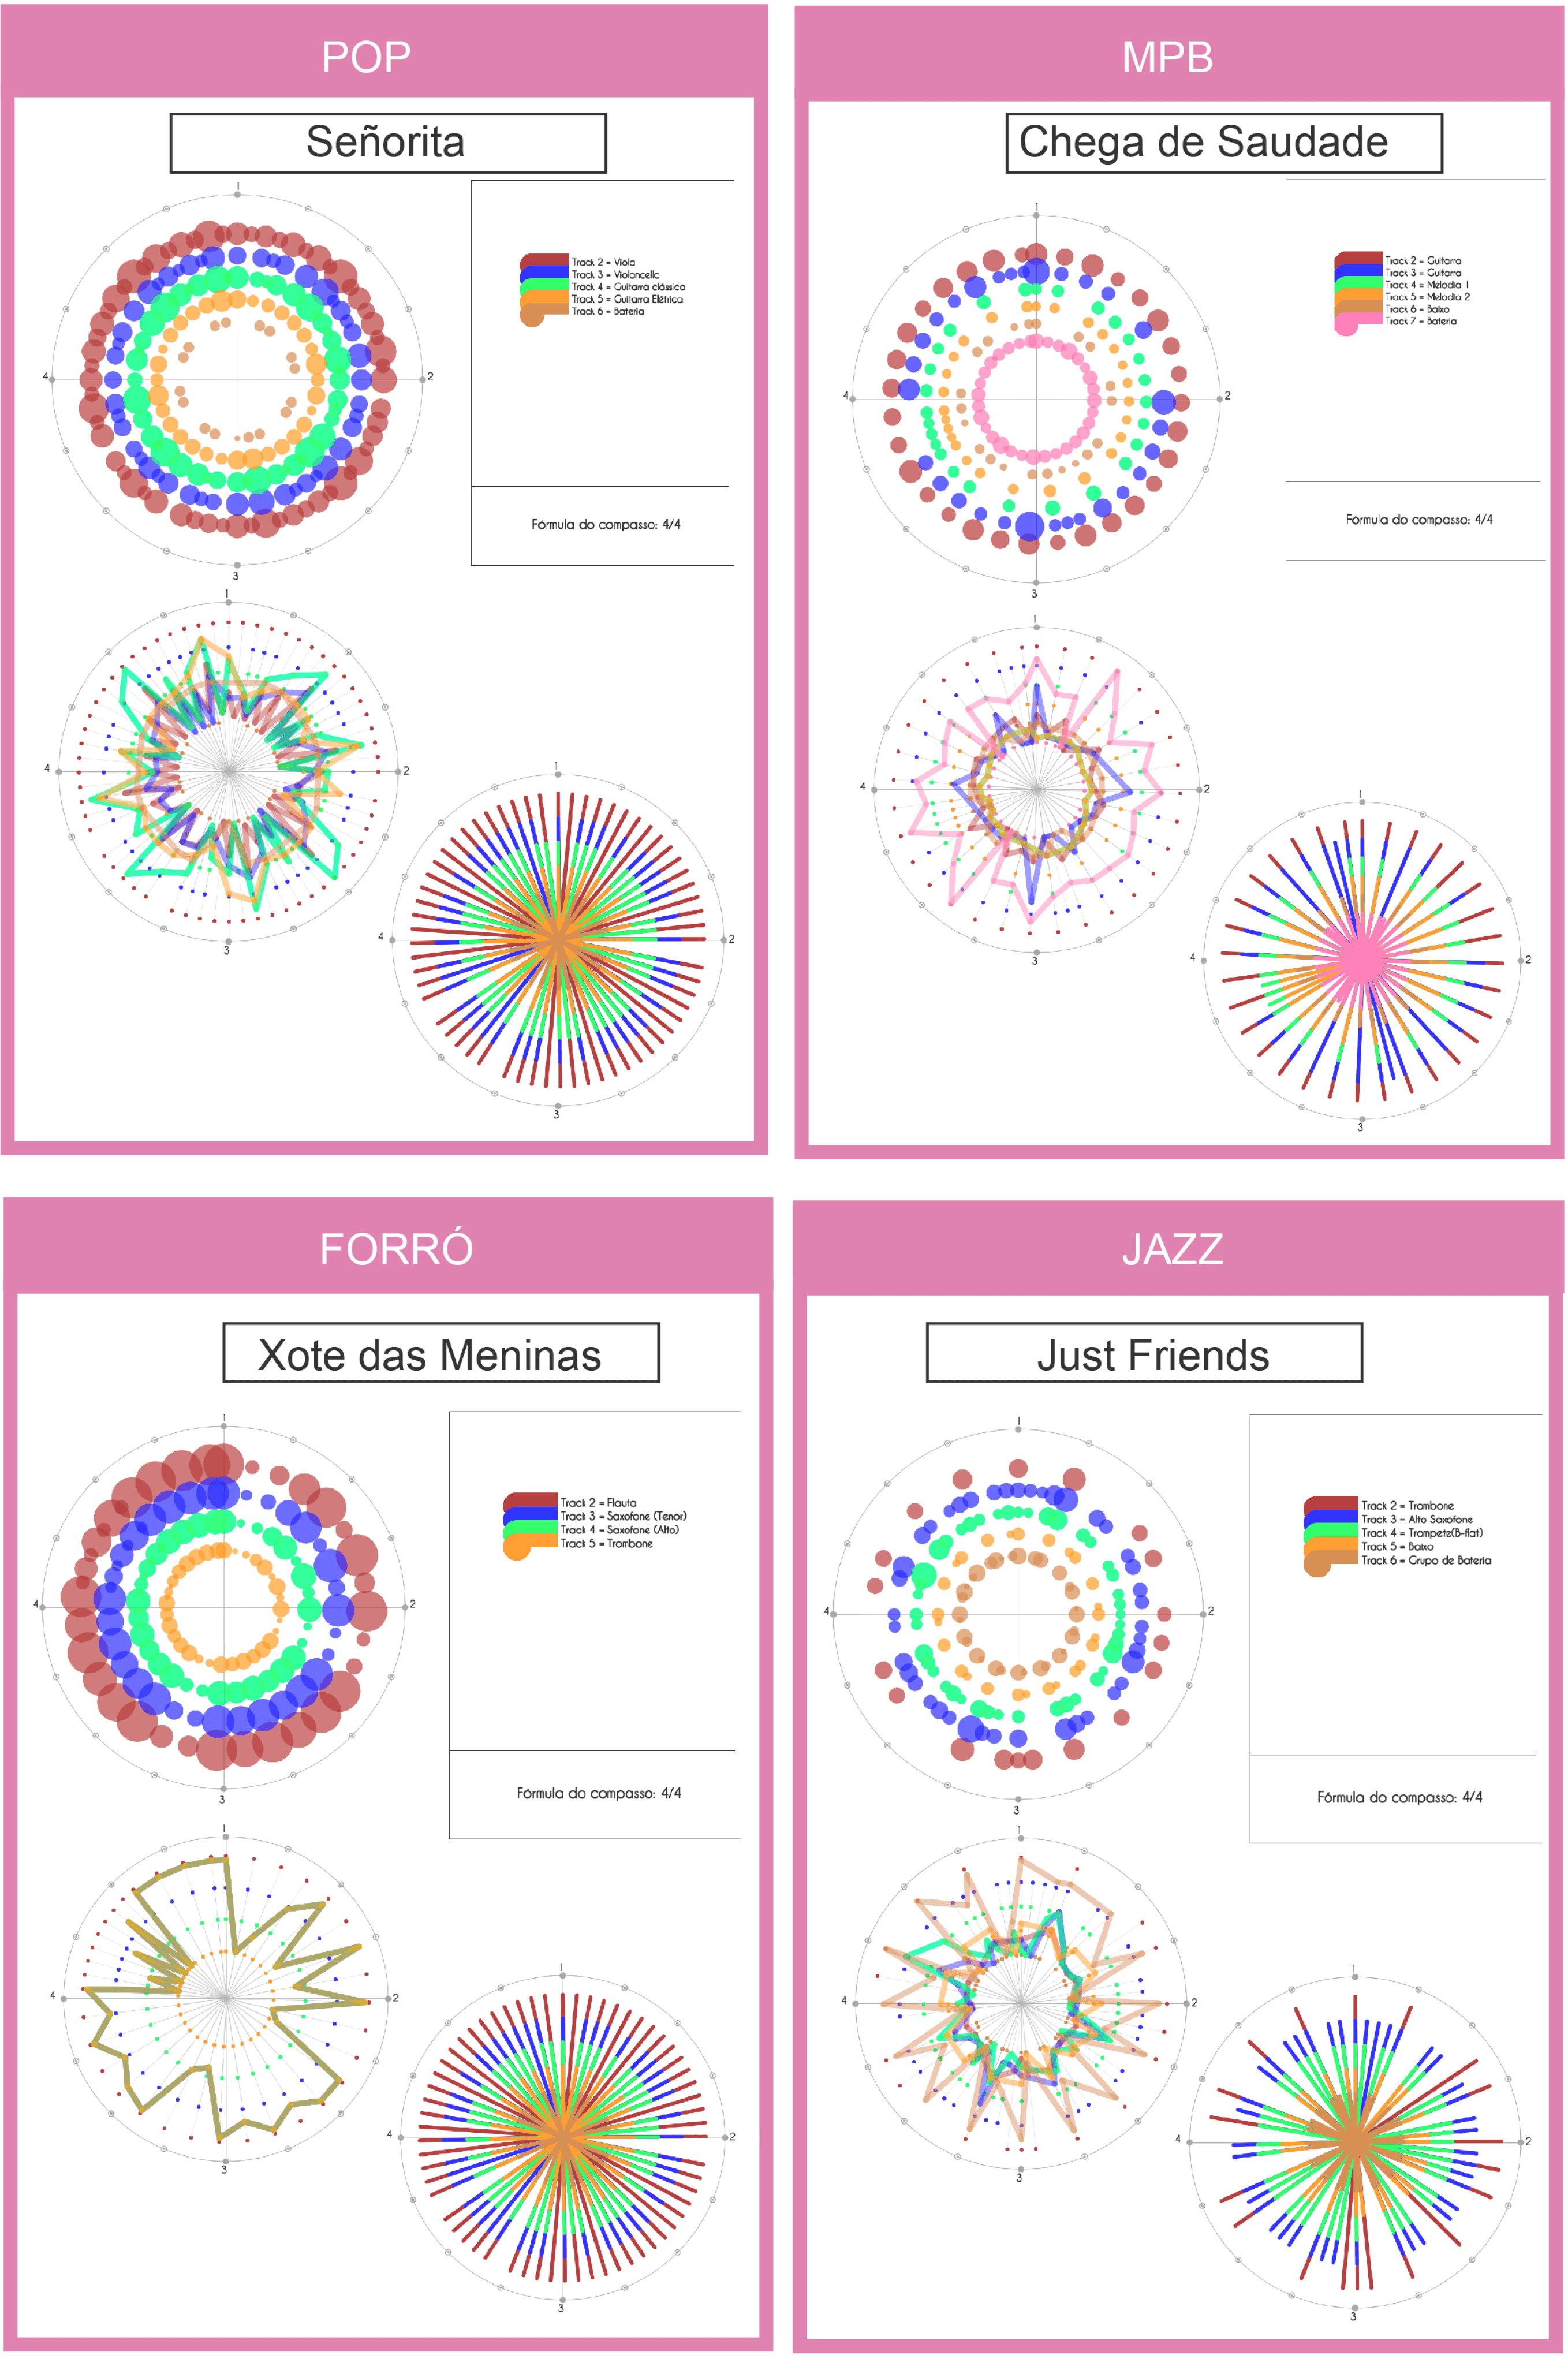
RESULT:
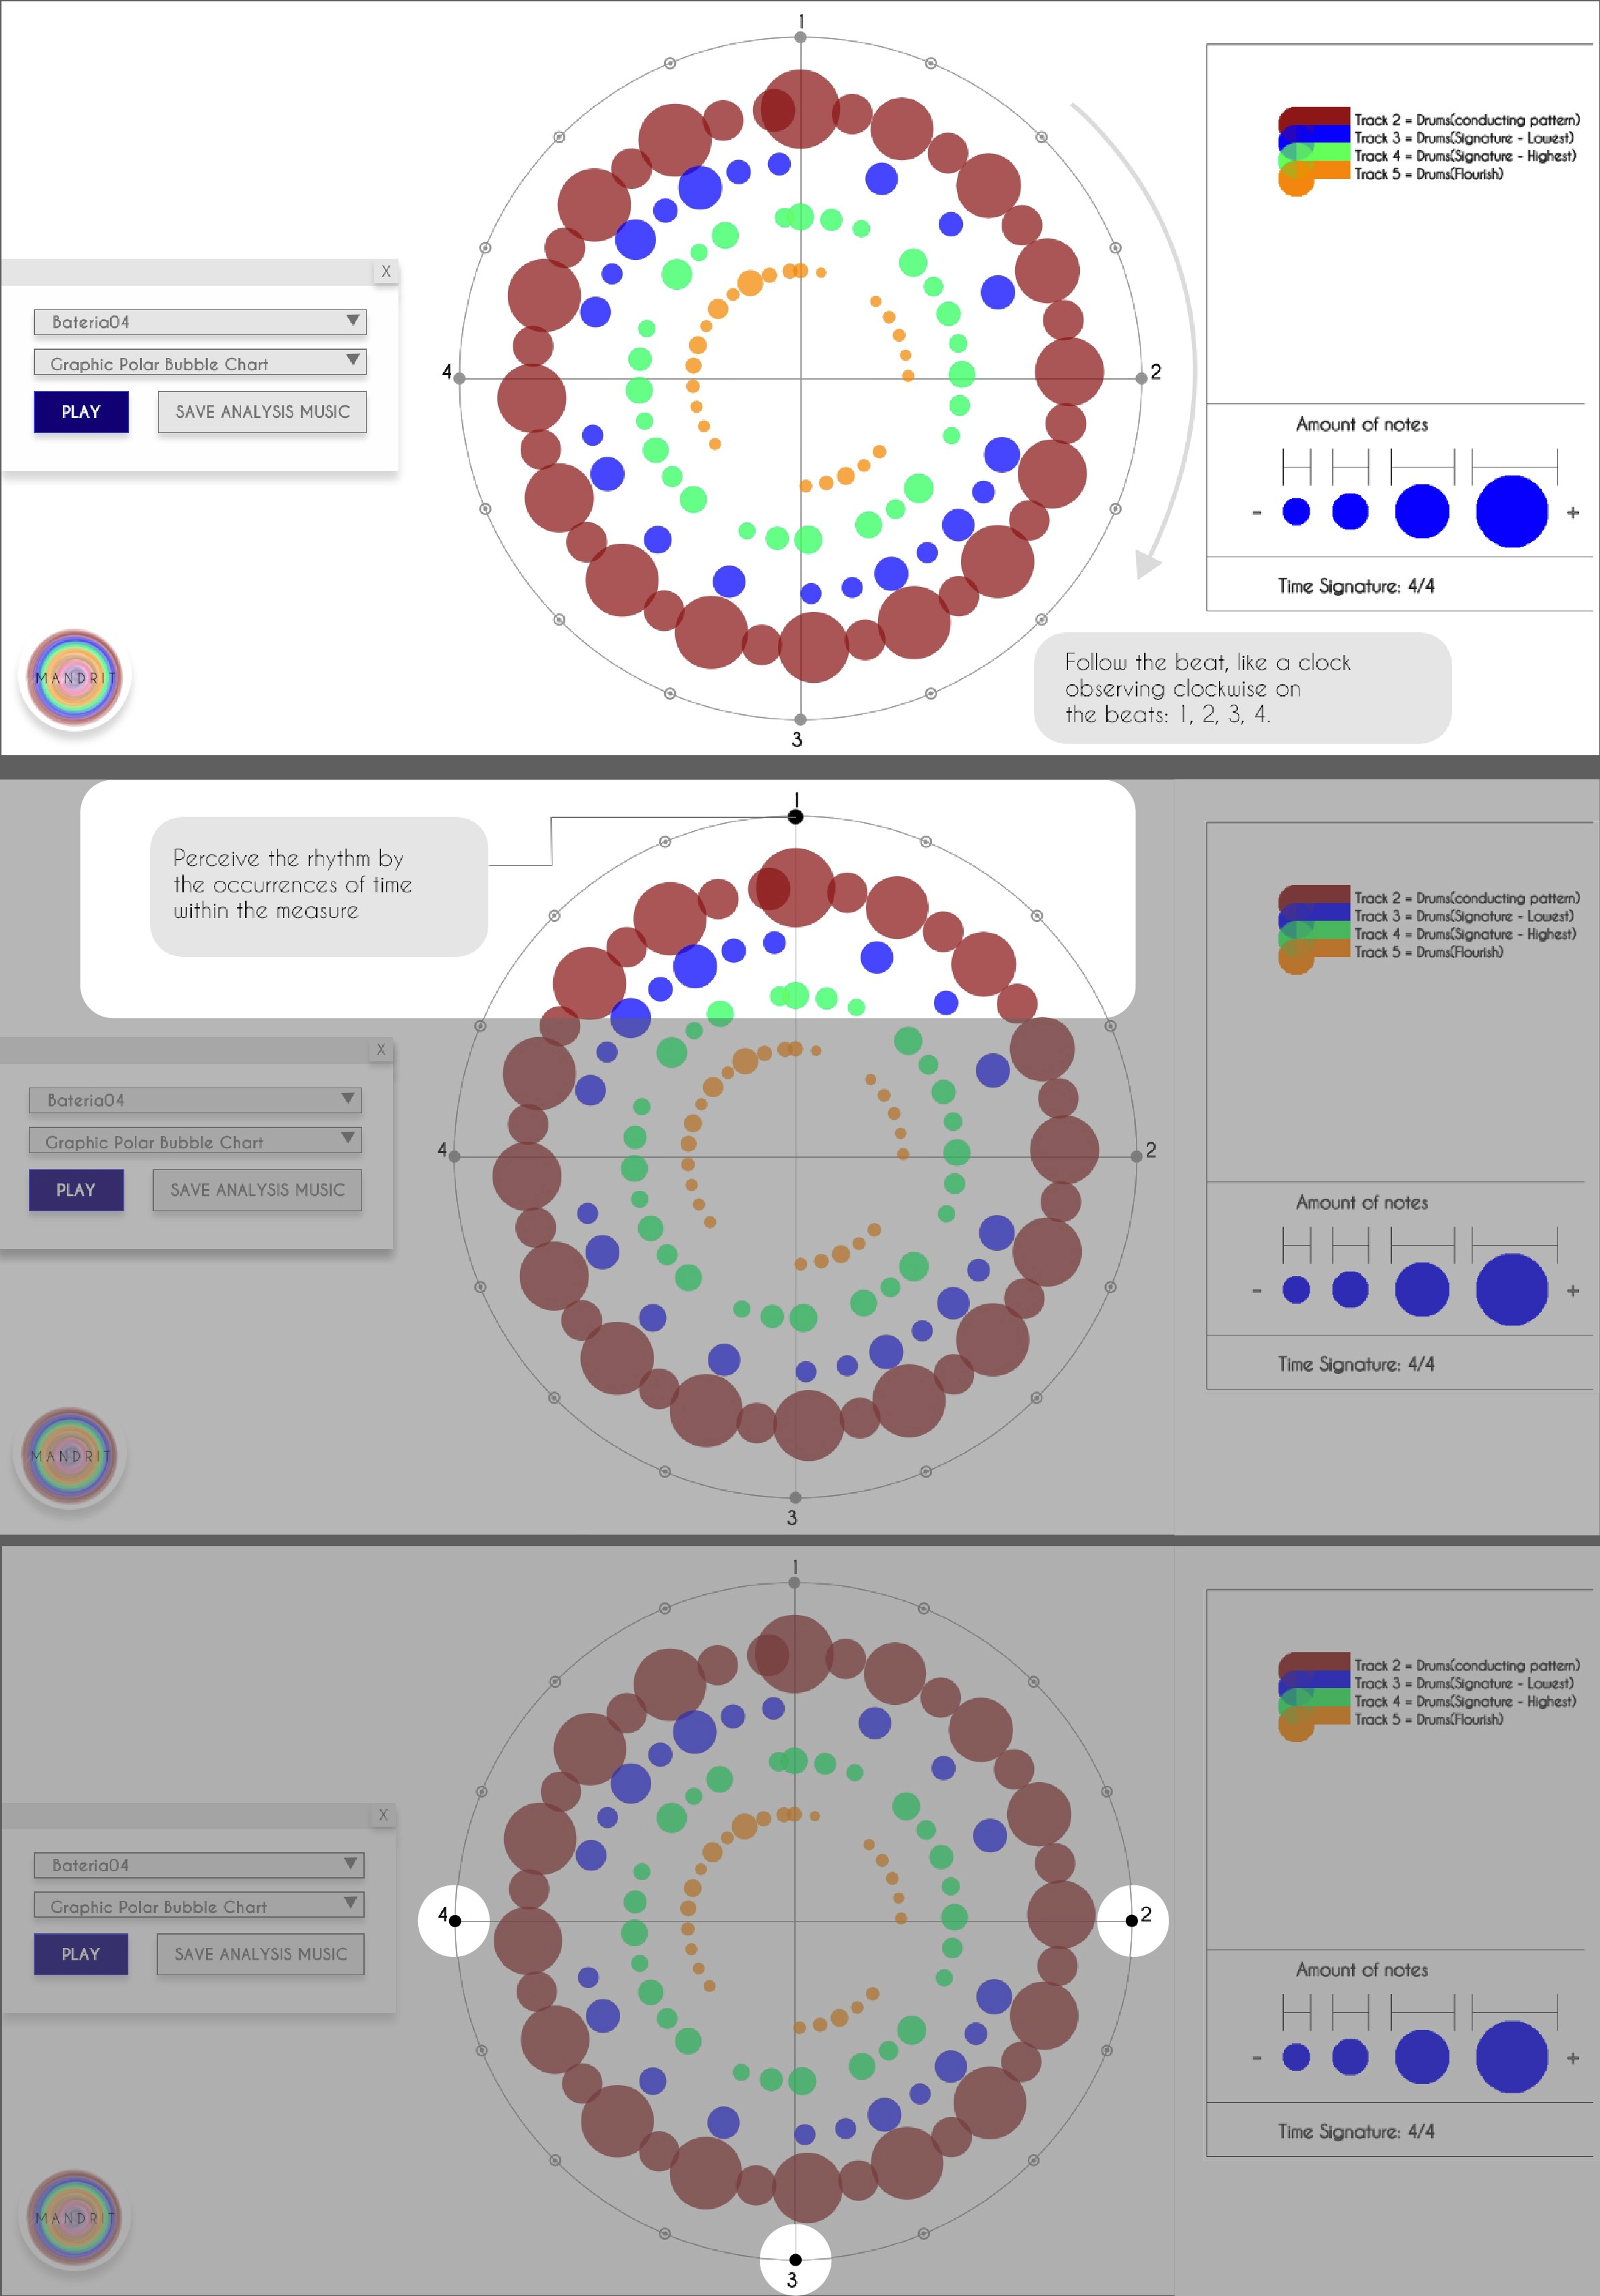
Develop a system that uses data extracted from MIDI files to plot graphs for different songs,
representing their rhythmic signatures.
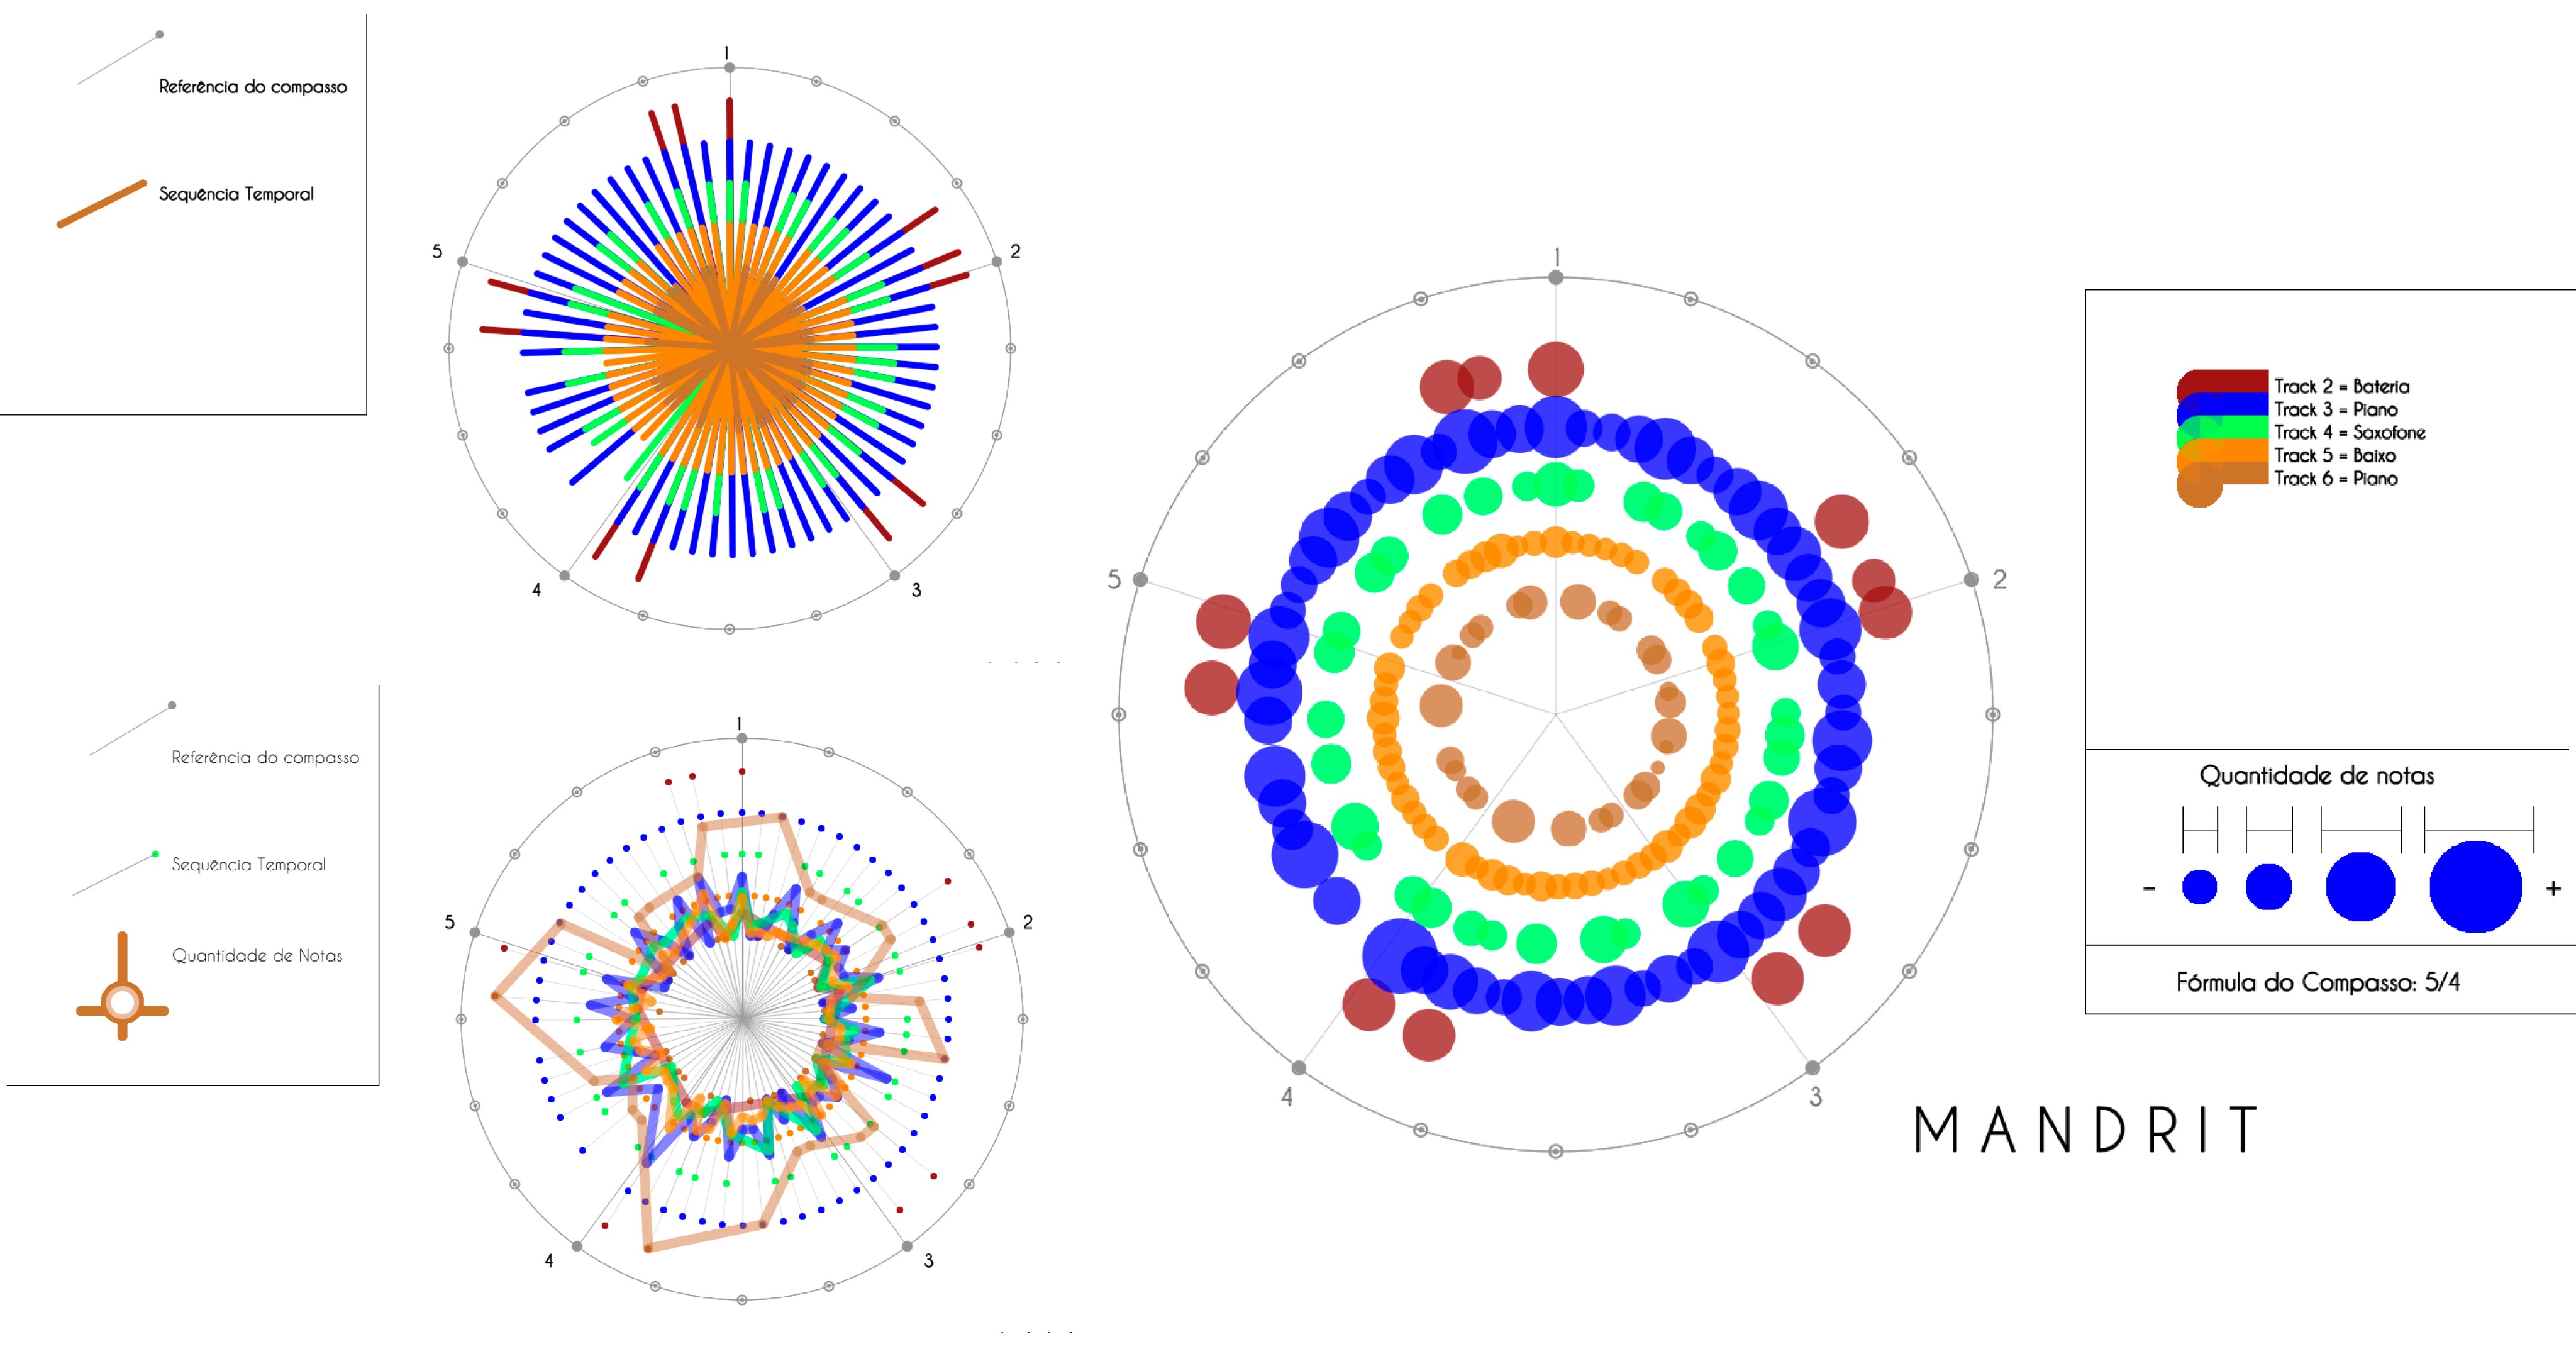
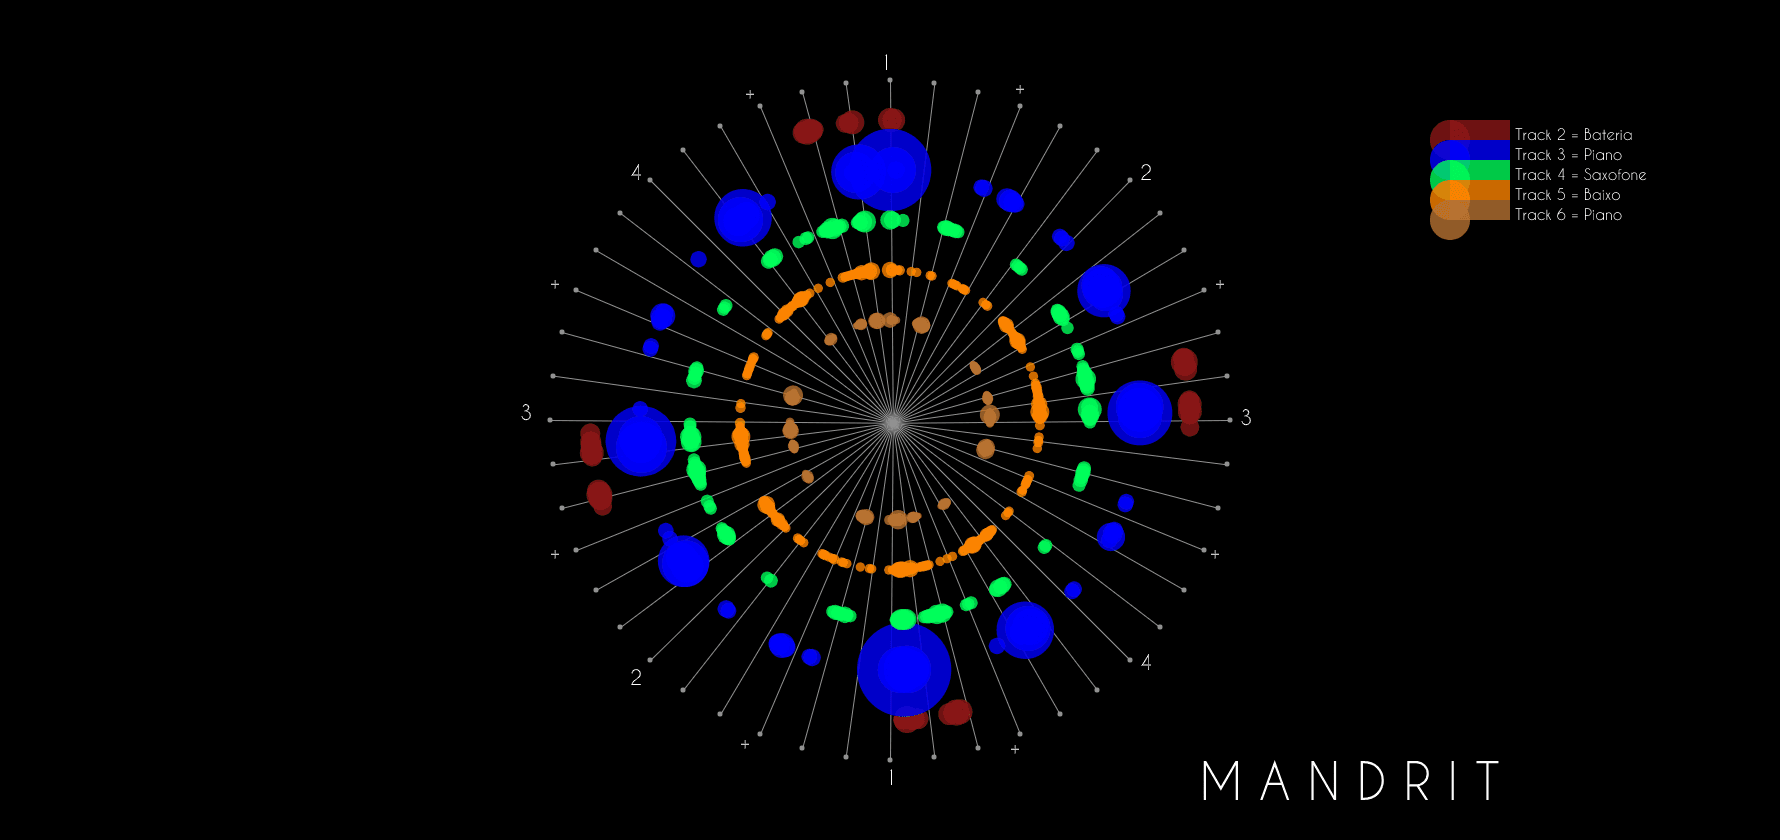
MANDRIT: a system for automatic generation of musical visualizations
for rhythm analysis
Mandrit was a project carried out by Mustic. You can explore the rhythmic visualization database here. Developed for the processing of musical content assisted by visualizations for recognizing patterns, similarities and instrumental correspondences and analyzing musical complexities.
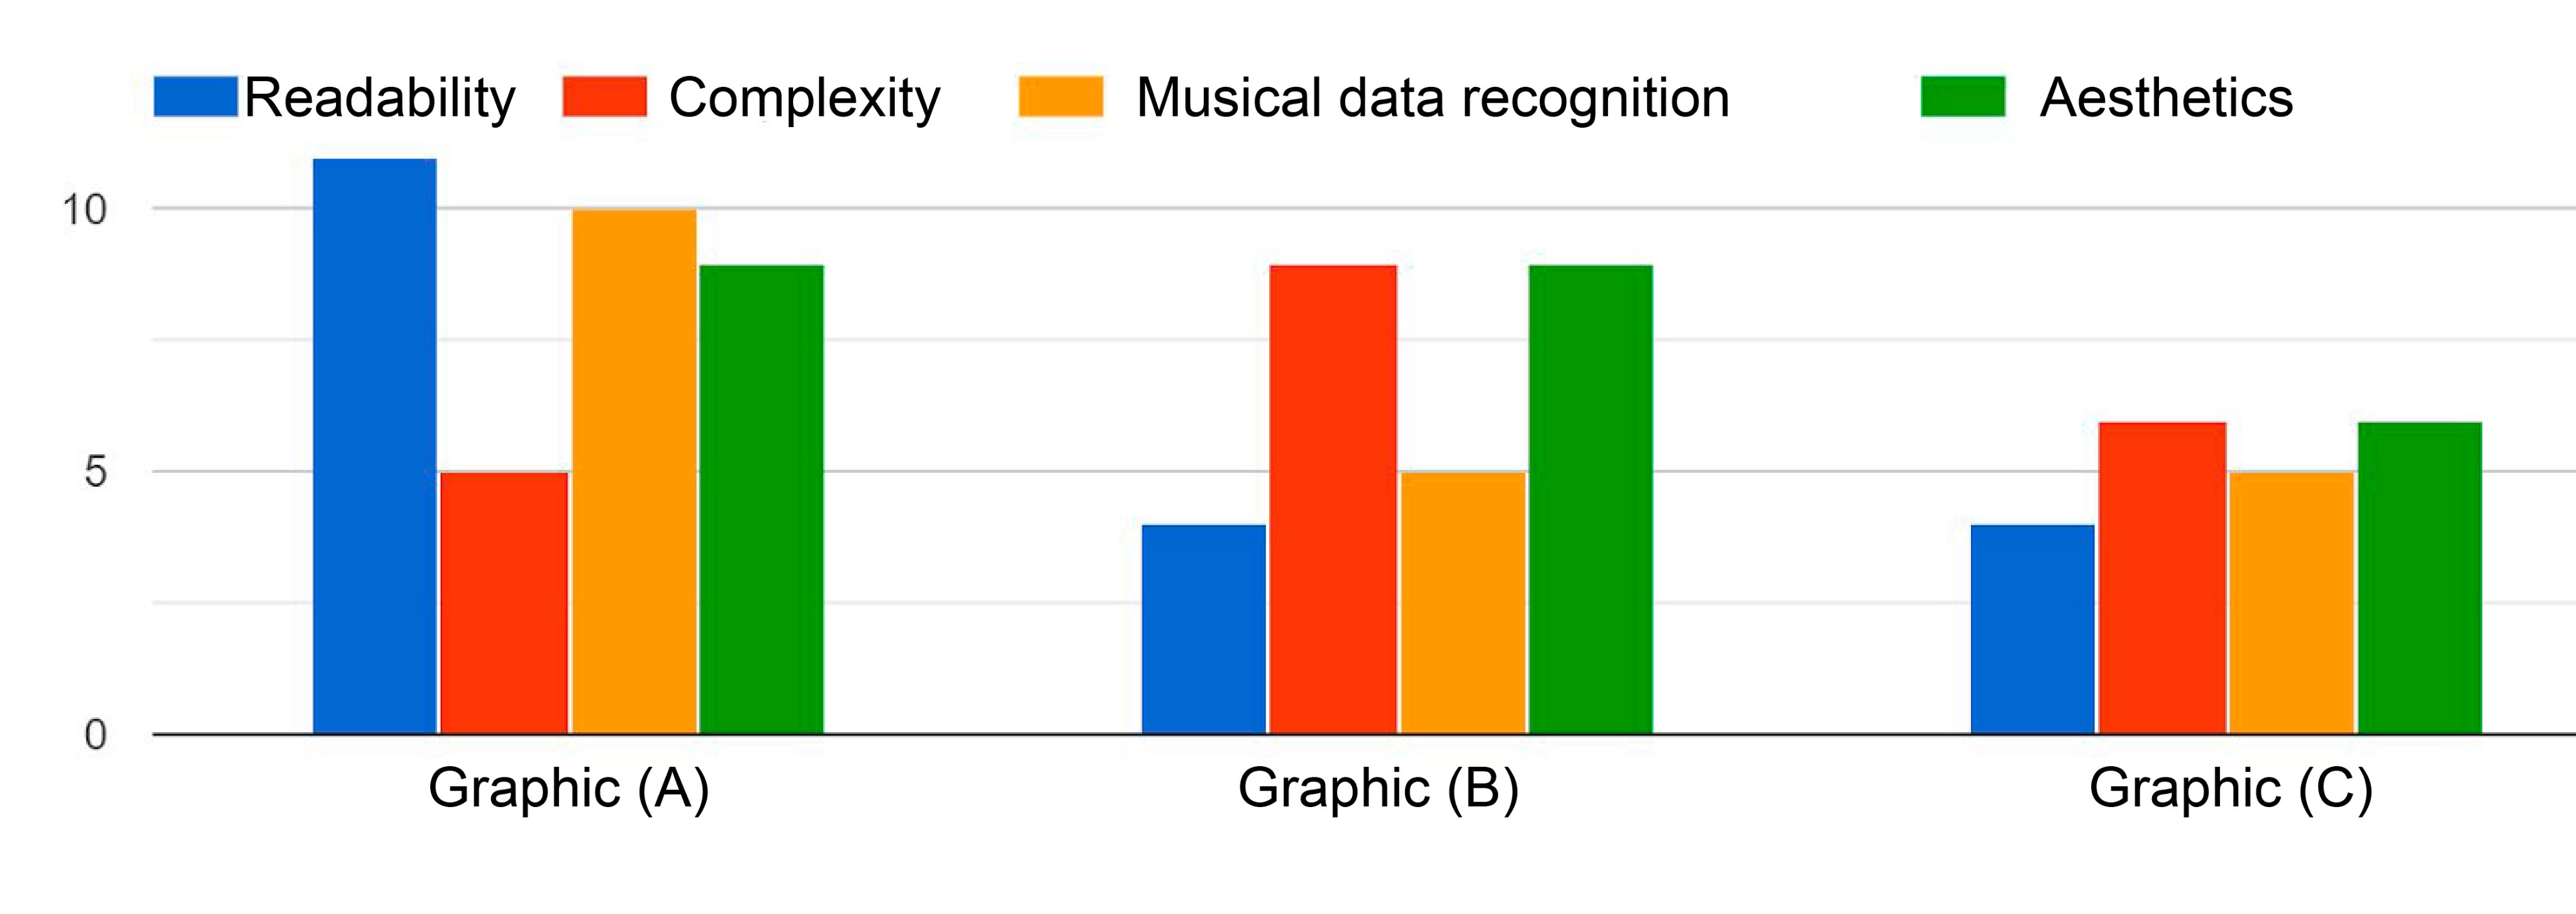
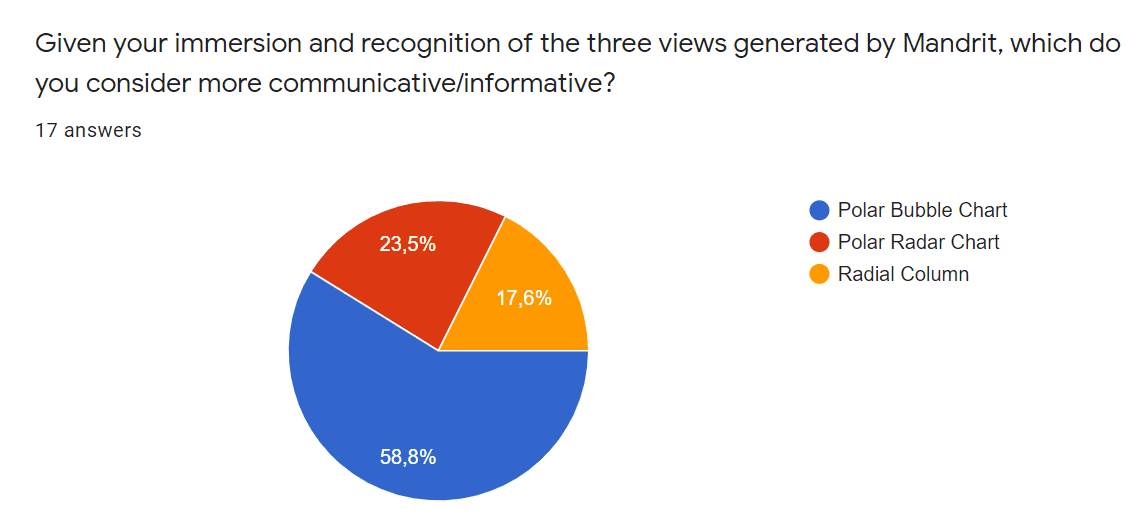
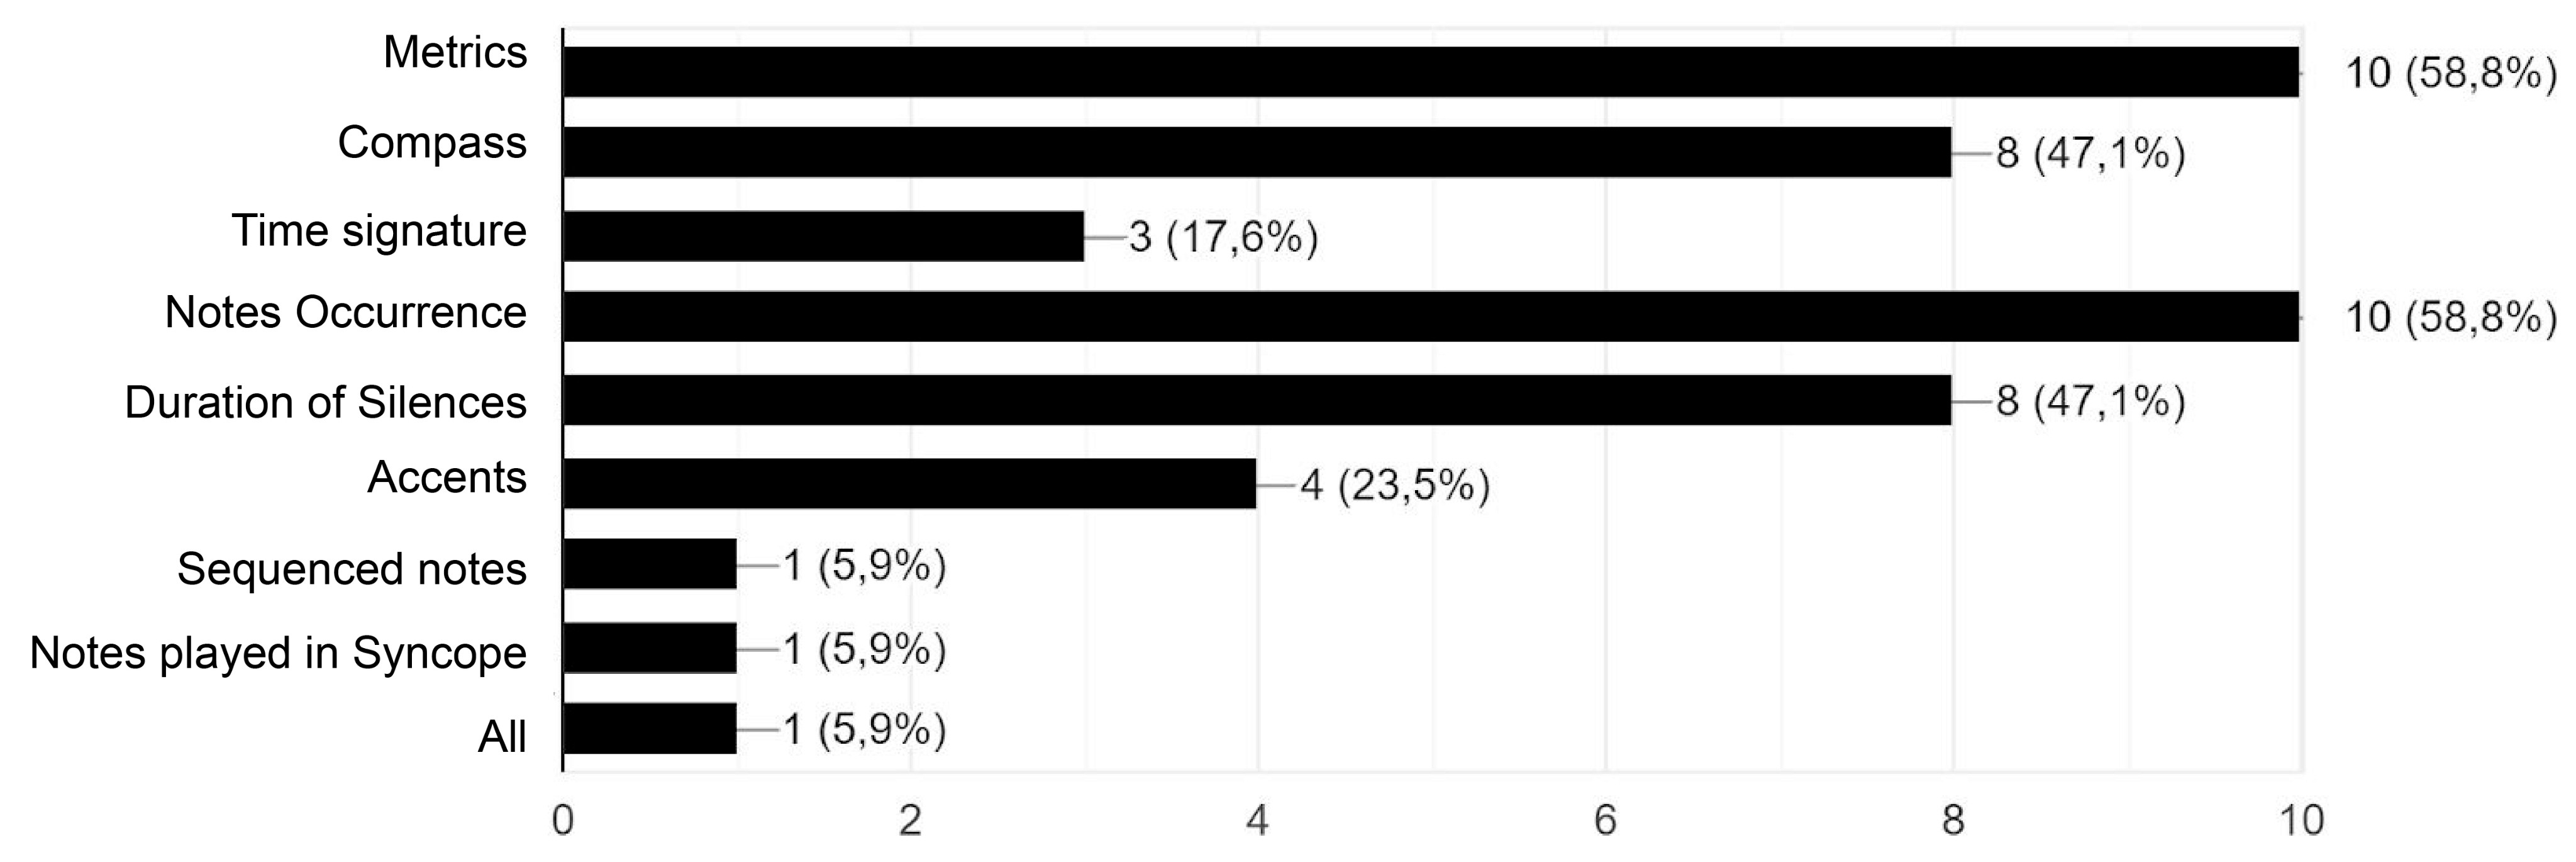
USABILITY TESTS
200 Visualizations
Assessment cycles with generated music visualizations and graph analysis.
10 Sessions
Sessions for rhythmic analysis with specialists,
focus on the analysis of Rhythm and feedback collection.
17 Users
Insights for improvements for static visualization with musical data, through qualitative and quantitative research.
Assessment cycles

Co-creation workshop
Profile
Did you have difficulty representing musical information?
Do you want to continue collaborating with research?
Musician
Designer
Visualization Analyst
03
©2023 – All Rights Reserved
Rute Maxsuelly | Product Designer
@Chapter Leader in the Community Ladies That UX Porto